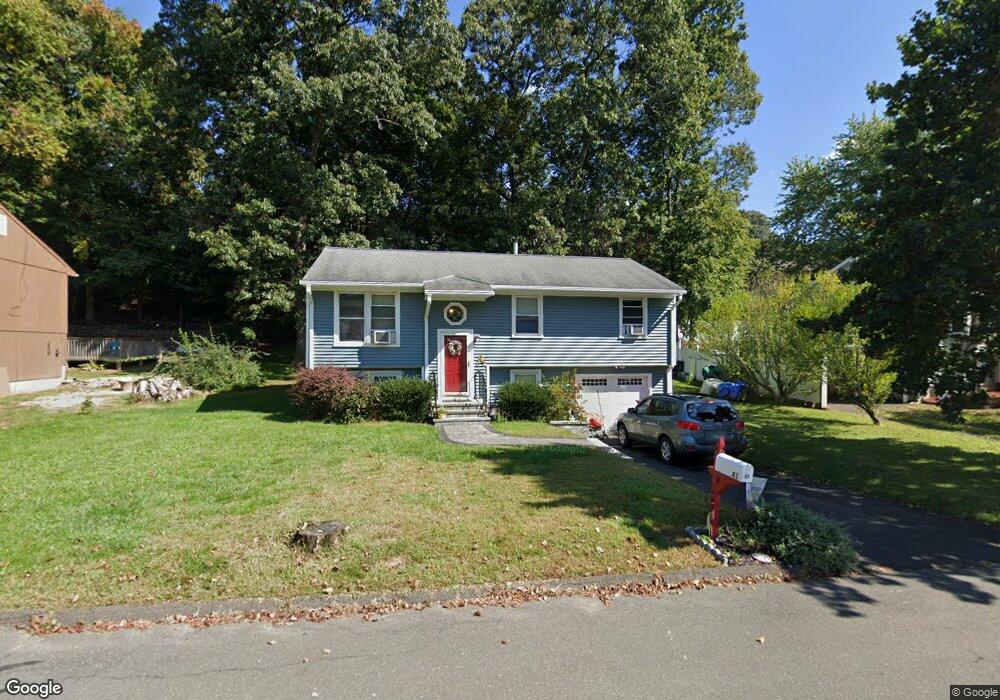
41 Celantano Dr Naugatuck, CT 06770
Estimated Value: $354,000 - $383,000
3
Beds
2
Baths
1,346
Sq Ft
$270/Sq Ft
Est. Value
About This Home
This home is located at 41 Celantano Dr, Naugatuck, CT 06770 and is currently estimated at $363,114, approximately $269 per square foot. 41 Celantano Dr is a home located in New Haven County with nearby schools including City Hill Middle School and Naugatuck High School.
Ownership History
Date
Name
Owned For
Owner Type
Purchase Details
Closed on
Apr 9, 2012
Sold by
Phaneuf Eric
Bought by
Pheneuf Heather
Current Estimated Value
Purchase Details
Closed on
Dec 14, 2010
Sold by
Perry Scott E and Perry Katie E
Bought by
Phaneuf Eric and Phaneuf Heather
Home Financials for this Owner
Home Financials are based on the most recent Mortgage that was taken out on this home.
Original Mortgage
$183,719
Interest Rate
4.24%
Mortgage Type
Purchase Money Mortgage
Purchase Details
Closed on
Mar 1, 2004
Sold by
Goodenough Michihiro N and Main Michelle
Bought by
Perry Katie E and Perry Scott E
Home Financials for this Owner
Home Financials are based on the most recent Mortgage that was taken out on this home.
Original Mortgage
$164,900
Interest Rate
5.65%
Mortgage Type
Purchase Money Mortgage
Purchase Details
Closed on
Oct 30, 2000
Sold by
Beyer Marie
Bought by
Goodenough Michihiro and Main Michele
Create a Home Valuation Report for This Property
The Home Valuation Report is an in-depth analysis detailing your home's value as well as a comparison with similar homes in the area
Home Values in the Area
Average Home Value in this Area
Purchase History
| Date | Buyer | Sale Price | Title Company |
|---|---|---|---|
| Pheneuf Heather | -- | -- | |
| Phaneuf Eric | $188,500 | -- | |
| Perry Katie E | $183,500 | -- | |
| Goodenough Michihiro | $128,000 | -- |
Source: Public Records
Mortgage History
| Date | Status | Borrower | Loan Amount |
|---|---|---|---|
| Previous Owner | Goodenough Michihiro | $183,719 | |
| Previous Owner | Goodenough Michihiro | $27,200 | |
| Previous Owner | Goodenough Michihiro | $164,900 | |
| Previous Owner | Goodenough Michihiro | $121,500 |
Source: Public Records
Tax History Compared to Growth
Tax History
| Year | Tax Paid | Tax Assessment Tax Assessment Total Assessment is a certain percentage of the fair market value that is determined by local assessors to be the total taxable value of land and additions on the property. | Land | Improvement |
|---|---|---|---|---|
| 2025 | $6,320 | $158,830 | $32,060 | $126,770 |
| 2024 | $6,638 | $158,830 | $32,060 | $126,770 |
| 2023 | $7,108 | $158,830 | $32,060 | $126,770 |
| 2022 | $5,609 | $117,460 | $33,530 | $83,930 |
| 2021 | $5,609 | $117,460 | $33,530 | $83,930 |
| 2020 | $5,536 | $115,930 | $33,530 | $82,400 |
| 2019 | $5,478 | $115,930 | $33,530 | $82,400 |
| 2018 | $5,451 | $112,740 | $47,250 | $65,490 |
| 2017 | $5,474 | $112,740 | $47,250 | $65,490 |
| 2016 | $5,374 | $112,740 | $47,250 | $65,490 |
| 2015 | $5,138 | $112,740 | $47,250 | $65,490 |
| 2014 | $5,080 | $112,740 | $47,250 | $65,490 |
| 2012 | $5,124 | $152,730 | $51,360 | $101,370 |
Source: Public Records
Map
Nearby Homes
- 71 Wisteria Dr
- 4 Wintergreen Ln
- 848 New Haven Rd
- 856 New Haven Rd
- 166 Wisteria Dr
- 170 Darcangelo Dr
- 575 S Main St
- 216 May St
- 141 General Patton Dr
- 46 Mulberry St
- 48 High St
- 1081 New Haven Rd Unit 4C
- 738 Beacon Valley Rd Unit 740
- 31 June St
- 62 Cambridge Ct
- 194 Beacon Valley Rd Unit Parcel 1971759
- 36 Hillview St
- 0 May St Unit 24032798
- 418 Horton Hill Rd
- 7 Fawn Meadow Dr