41 Central St Cranston, RI 02905
Edgewood NeighborhoodEstimated Value: $443,000 - $489,000
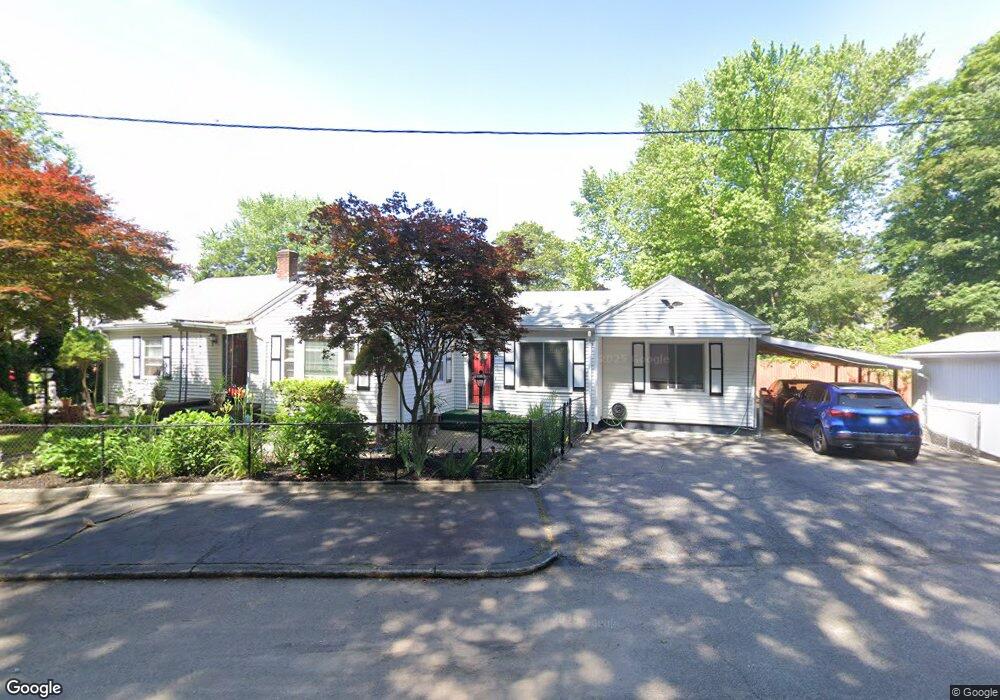
About This Home
This home is located at 41 Central St, Cranston, RI 02905 and is currently estimated at $473,342, approximately $222 per square foot. 41 Central St is a home located in Providence County with nearby schools including Edgewood Highland Elementary School, Park View Middle School, and Cranston High School East.
Ownership History
We collect this data history from publicly available records. To have your information removed, we recommend requesting removal directly through your county’s website.
Purchase Details
Purchase Details
Purchase Details
Home Values in the Area
Average Home Value in this Area
Purchase History
We collect this data history from publicly available records. To have your information removed, we recommend requesting removal directly through your county’s website.
| Date | Buyer | Sale Price | Title Company |
|---|---|---|---|
| -- | None Available | ||
| -- | None Available | ||
| -- | None Available | ||
| -- | None Available | ||
| -- | None Available | ||
| -- | None Available |
Tax History
We collect this data history from publicly available records. To have your information removed, we recommend requesting removal directly through your county’s website.
| Year | Tax Paid | Tax Assessment Tax Assessment Total Assessment is a certain percentage of the fair market value that is determined by local assessors to be the total taxable value of land and additions on the property. | Land | Improvement |
|---|---|---|---|---|
| 2025 | $4,920 | $354,500 | $110,100 | $244,400 |
| 2024 | $4,825 | $354,500 | $110,100 | $244,400 |
| 2023 | $4,602 | $243,500 | $72,500 | $171,000 |
| 2022 | $4,507 | $243,500 | $72,500 | $171,000 |
| 2021 | $4,383 | $243,500 | $72,500 | $171,000 |
| 2020 | $4,135 | $199,100 | $69,000 | $130,100 |
| 2019 | $4,135 | $199,100 | $69,000 | $130,100 |
| 2018 | $4,040 | $199,100 | $69,000 | $130,100 |
| 2017 | $4,106 | $179,000 | $62,100 | $116,900 |
| 2016 | $4,019 | $179,000 | $62,100 | $116,900 |
| 2015 | $4,019 | $179,000 | $62,100 | $116,900 |
| 2014 | $3,938 | $172,400 | $62,100 | $110,300 |
Map
- 136 Armington St
- 162 Armington St
- 1061 Narragansett Blvd
- 1058 Narragansett Blvd
- 1144 Narragansett Blvd
- 308 Smith St
- 8 Rushton Dr
- 175 Montgomery Ave
- 95 Bay View Ave
- 5 Dennis Ave
- 25 Talbot Manor
- 183 Alabama Ave
- 155 Alabama Ave
- 172 Massachusetts Ave
- 274 Montgomery Ave
- 268 Alabama Ave
- 273 Montgomery Ave
- 1200 Narragansett Blvd
- 106 Norwood Ave Unit 1
- 132 Washington Ave Unit 134
- 143 Armington St
- 141 Armington St
- 155 Armington St
- 178 Narragansett St
- 139 Armington St
- 166 Narragansett St Unit 2
- 172 Narragansett St
- 172 Narragansett St Unit 2
- 174 Narragansett St Unit 2
- 174 Narragansett St
- 162 Narragansett St
- 142 Armington St
- 135 Armington St
- 6 Central St
- 157 Armington St
- 140 Armington St
- 156 Narragansett St
- 2 Central St
- 90 Narragansett St
- 156 Armington St
Ask me questions while you tour the home.