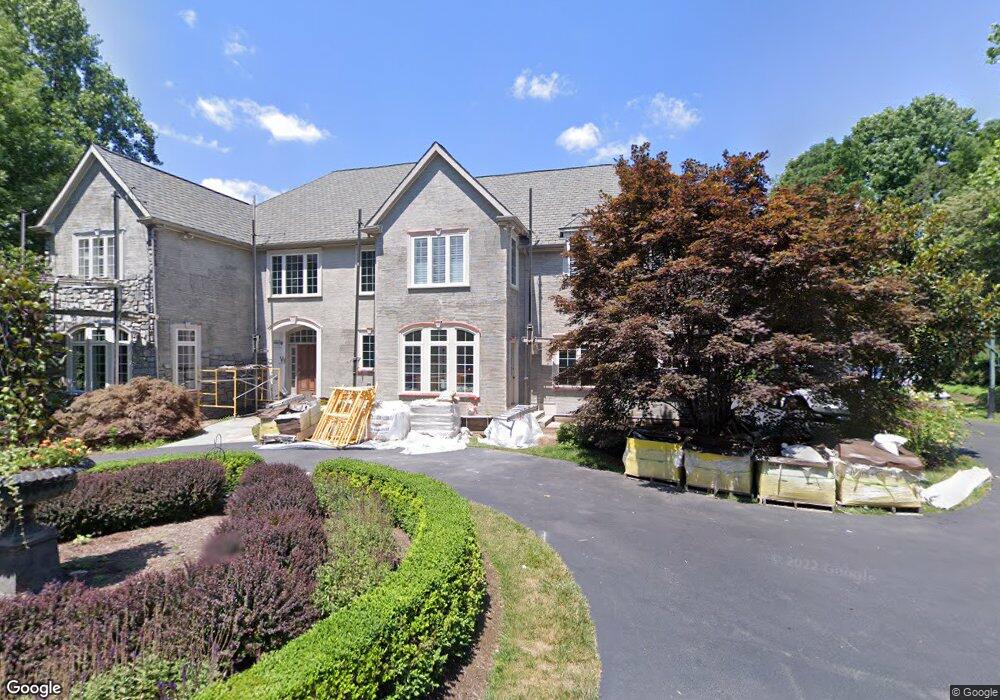
41 Chapel Way Malvern, PA 19355
Estimated Value: $705,000 - $1,720,000
5
Beds
6
Baths
5,589
Sq Ft
$239/Sq Ft
Est. Value
About This Home
This home is located at 41 Chapel Way, Malvern, PA 19355 and is currently estimated at $1,335,455, approximately $238 per square foot. 41 Chapel Way is a home located in Chester County with nearby schools including Charlestown Elementary School, Great Valley Middle School, and Great Valley High School.
Ownership History
Date
Name
Owned For
Owner Type
Purchase Details
Closed on
Jul 20, 2011
Sold by
Rosati Christopher L and Rosati Susan A
Bought by
Rosati Christopher L
Current Estimated Value
Home Financials for this Owner
Home Financials are based on the most recent Mortgage that was taken out on this home.
Original Mortgage
$1,000,000
Outstanding Balance
$695,712
Interest Rate
4.75%
Mortgage Type
Adjustable Rate Mortgage/ARM
Estimated Equity
$639,743
Purchase Details
Closed on
Aug 17, 2001
Sold by
Feeney Catherine D and Feeney Catherine
Bought by
L H B S Associates
Home Financials for this Owner
Home Financials are based on the most recent Mortgage that was taken out on this home.
Original Mortgage
$2,340,859
Interest Rate
6.99%
Create a Home Valuation Report for This Property
The Home Valuation Report is an in-depth analysis detailing your home's value as well as a comparison with similar homes in the area
Home Values in the Area
Average Home Value in this Area
Purchase History
| Date | Buyer | Sale Price | Title Company |
|---|---|---|---|
| Rosati Christopher L | -- | None Available | |
| L H B S Associates | $778,194 | -- |
Source: Public Records
Mortgage History
| Date | Status | Borrower | Loan Amount |
|---|---|---|---|
| Open | Rosati Christopher L | $1,000,000 | |
| Previous Owner | L H B S Associates | $2,340,859 |
Source: Public Records
Tax History Compared to Growth
Tax History
| Year | Tax Paid | Tax Assessment Tax Assessment Total Assessment is a certain percentage of the fair market value that is determined by local assessors to be the total taxable value of land and additions on the property. | Land | Improvement |
|---|---|---|---|---|
| 2025 | $14,336 | $495,000 | $171,950 | $323,050 |
| 2024 | $14,336 | $495,000 | $171,950 | $323,050 |
| 2023 | $17,998 | $637,740 | $171,950 | $465,790 |
| 2022 | $17,641 | $637,740 | $171,950 | $465,790 |
| 2021 | $17,290 | $637,740 | $171,950 | $465,790 |
| 2020 | $17,008 | $637,740 | $171,950 | $465,790 |
| 2019 | $4,179 | $637,740 | $171,950 | $465,790 |
| 2018 | $16,530 | $637,740 | $171,950 | $465,790 |
| 2017 | $16,530 | $637,740 | $171,950 | $465,790 |
| 2016 | $14,542 | $637,740 | $171,950 | $465,790 |
| 2015 | $14,542 | $637,740 | $171,950 | $465,790 |
| 2014 | $14,542 | $637,740 | $171,950 | $465,790 |
Source: Public Records
Map
Nearby Homes
- 26 Shamrock Hill Ln
- 1123 Bodine Rd
- 23 Ashtree Ln Unit 140
- 88 Sagewood Dr Unit 186
- 94 Sagewood Dr Unit 189
- 925 Drovers Ln
- 14 Clayton Ct
- 204 Yorktown Ct
- 92 Granville Way
- 10 Spruce Ave
- 108 Elizabeth Ct
- 105 Yorktown Ct
- 273 Phoenixville Pike
- 325 Piper Ln
- 18 Ashlawn Rd
- 1019 Kimberton Rd
- 116 Three Ponds Ln
- Santorini Plan at Worthington Farm - Luxury Single-Family Homes
- Monaco Plan at Worthington Farm - Luxury Single-Family Homes
- Lisbon Plan at Worthington Farm - Luxury Single-Family Homes
- 36 Chapel Way
- 33 Greenbriar Cir
- The Greenbriar - Old Kingfisher Ln
- 2212 Bodine Rd
- 2208 Bodine Rd
- 6 Greenbriar Cir
- 35 Briar Way
- 2260 Bodine Rd
- 42 Briar Way
- 10 Rapps Run Dr
- 2220 Bodine Rd
- Lot 1 Bodine Rd
- 00 Bodine Rd
- 0 Bodine Rd
- 0 Bodine Rd
- 58 Briar Way
- 7 Rapps Run Dr
- 38 Rosewood Ln
- 34 Rosewood Ln
- 2227 Bodine Rd