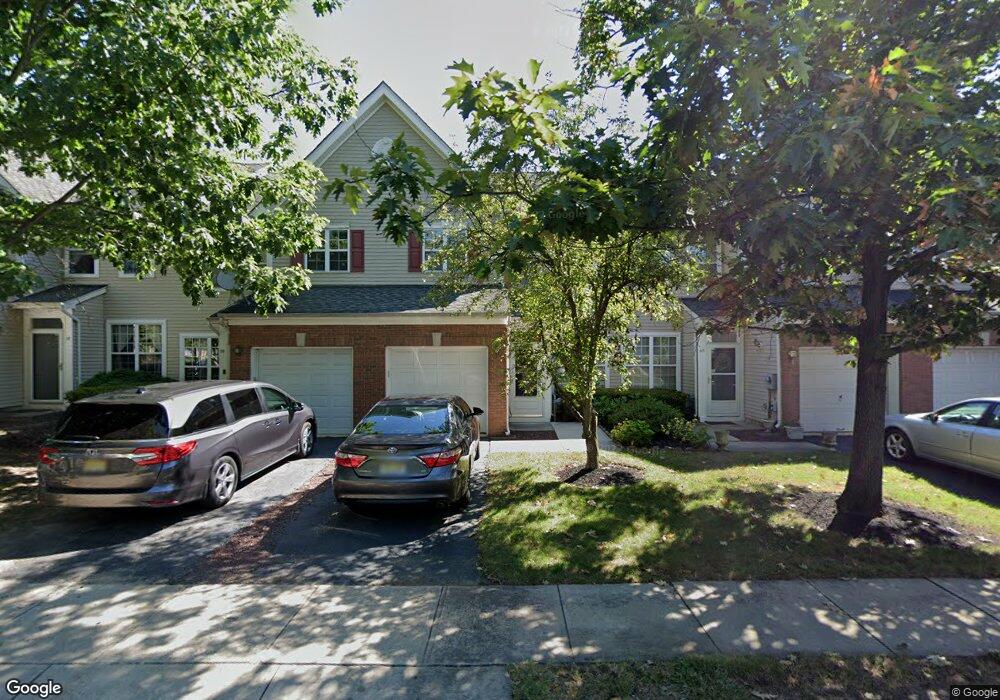
41 Chatham Ct Trenton, NJ 08691
Estimated Value: $488,000 - $607,000
3
Beds
3
Baths
1,862
Sq Ft
$284/Sq Ft
Est. Value
About This Home
This home is located at 41 Chatham Ct, Trenton, NJ 08691 and is currently estimated at $529,577, approximately $284 per square foot. 41 Chatham Ct is a home located in Mercer County with nearby schools including Sharon Elementary School, Pond Road Middle School, and Robbinsville High School.
Ownership History
Date
Name
Owned For
Owner Type
Purchase Details
Closed on
Jun 27, 2011
Sold by
Rao Sidhartha and Kaplowitz Corrine
Bought by
Drake Dennis
Current Estimated Value
Home Financials for this Owner
Home Financials are based on the most recent Mortgage that was taken out on this home.
Original Mortgage
$70,000
Interest Rate
4.62%
Mortgage Type
Purchase Money Mortgage
Purchase Details
Closed on
Aug 23, 2002
Sold by
Northrop John
Bought by
Rao Sidhartha and Kaplowitz Corrine
Home Financials for this Owner
Home Financials are based on the most recent Mortgage that was taken out on this home.
Original Mortgage
$140,000
Interest Rate
6.48%
Mortgage Type
Purchase Money Mortgage
Purchase Details
Closed on
Feb 18, 1999
Sold by
Sharbell Washington Inc
Bought by
Northrop John and Northrop John A
Home Financials for this Owner
Home Financials are based on the most recent Mortgage that was taken out on this home.
Original Mortgage
$144,854
Interest Rate
6.78%
Mortgage Type
FHA
Create a Home Valuation Report for This Property
The Home Valuation Report is an in-depth analysis detailing your home's value as well as a comparison with similar homes in the area
Home Values in the Area
Average Home Value in this Area
Purchase History
| Date | Buyer | Sale Price | Title Company |
|---|---|---|---|
| Drake Dennis | $290,000 | Monmouth Title Agency | |
| Rao Sidhartha | $235,000 | -- | |
| Northrop John | $145,928 | -- |
Source: Public Records
Mortgage History
| Date | Status | Borrower | Loan Amount |
|---|---|---|---|
| Previous Owner | Drake Dennis | $70,000 | |
| Previous Owner | Rao Sidhartha | $140,000 | |
| Previous Owner | Northrop John | $144,854 |
Source: Public Records
Tax History Compared to Growth
Tax History
| Year | Tax Paid | Tax Assessment Tax Assessment Total Assessment is a certain percentage of the fair market value that is determined by local assessors to be the total taxable value of land and additions on the property. | Land | Improvement |
|---|---|---|---|---|
| 2025 | $9,785 | $292,800 | $129,000 | $163,800 |
| 2024 | $9,132 | $292,800 | $129,000 | $163,800 |
| 2023 | $9,132 | $292,800 | $129,000 | $163,800 |
| 2022 | $8,778 | $292,800 | $129,000 | $163,800 |
| 2021 | $8,652 | $292,800 | $129,000 | $163,800 |
| 2020 | $8,405 | $292,800 | $129,000 | $163,800 |
| 2019 | $8,658 | $292,800 | $129,000 | $163,800 |
| 2018 | $8,602 | $292,800 | $129,000 | $163,800 |
| 2017 | $8,585 | $292,800 | $129,000 | $163,800 |
| 2016 | $8,506 | $292,800 | $129,000 | $163,800 |
| 2015 | $8,127 | $292,800 | $129,000 | $163,800 |
| 2014 | $8,156 | $292,800 | $129,000 | $163,800 |
Source: Public Records
Map
Nearby Homes
- 83 Malsbury St
- 5 Dunston Ln
- 21 Eldridge Dr
- 16 Tasley Ct
- 29 Faxon Dr
- 15 Newtown Blvd
- 10 North St
- 84 Wyndham Place
- 109 Endsleigh Ct
- 117 George St
- 62 Wyndham Place
- 168 Wyndham Place
- 13 Stanwyck Ct
- 7 Anderson Ln
- 968 Robbinsville Edinburg Rd Unit 306
- 968 Robbins-Edinburg Unit 305
- 144 Tynemouth Ct
- 2330 Route 33 Unit 315
- 2346 Route 33 Unit 202
- 2346 Route 33 Unit 308