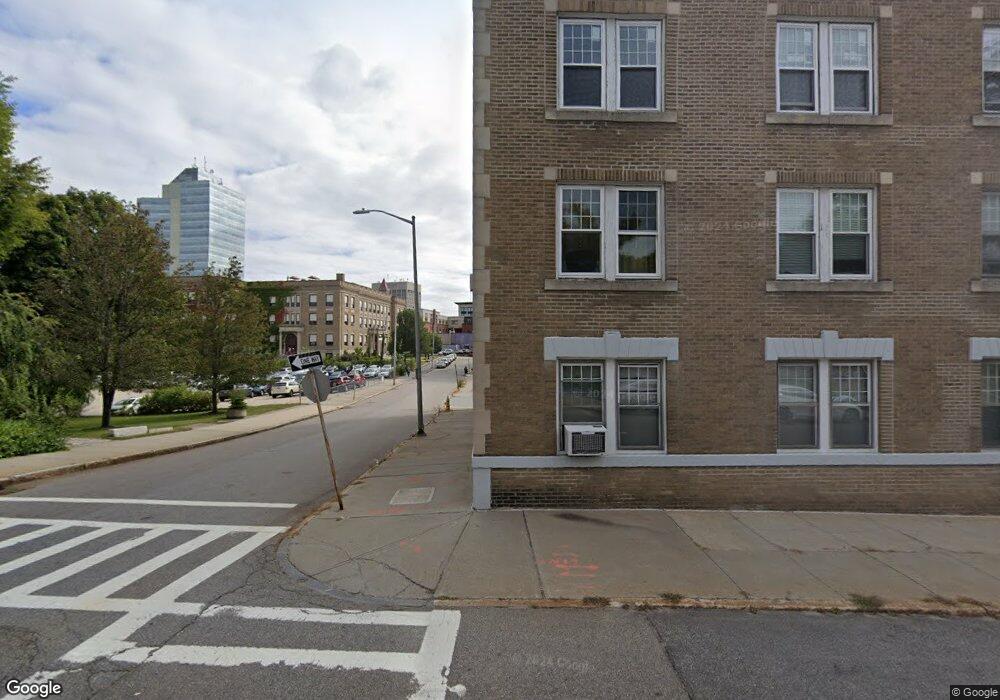
41 Chatham St Unit 7 Worcester, MA 01609
Elm Park NeighborhoodEstimated Value: $246,000 - $309,128
2
Beds
1
Bath
1,097
Sq Ft
$246/Sq Ft
Est. Value
About This Home
This home is located at 41 Chatham St Unit 7, Worcester, MA 01609 and is currently estimated at $269,782, approximately $245 per square foot. 41 Chatham St Unit 7 is a home located in Worcester County with nearby schools including Jacob Hiatt Magnet School, Chandler Magnet, and Elm Park Elementary School.
Ownership History
Date
Name
Owned For
Owner Type
Purchase Details
Closed on
Sep 29, 2000
Sold by
Baker Roberta M
Bought by
Baron Charlene A
Current Estimated Value
Home Financials for this Owner
Home Financials are based on the most recent Mortgage that was taken out on this home.
Original Mortgage
$35,900
Interest Rate
7.94%
Mortgage Type
Purchase Money Mortgage
Purchase Details
Closed on
Dec 15, 1992
Sold by
Greene Stephen P and Ashenburg Beth
Bought by
Baker Roberta M
Home Financials for this Owner
Home Financials are based on the most recent Mortgage that was taken out on this home.
Original Mortgage
$36,900
Interest Rate
8.16%
Mortgage Type
Purchase Money Mortgage
Purchase Details
Closed on
Mar 25, 1992
Sold by
Kelley Thomas J
Bought by
Greene Stephen P and Ashenburg Beth
Create a Home Valuation Report for This Property
The Home Valuation Report is an in-depth analysis detailing your home's value as well as a comparison with similar homes in the area
Home Values in the Area
Average Home Value in this Area
Purchase History
| Date | Buyer | Sale Price | Title Company |
|---|---|---|---|
| Baron Charlene A | $37,800 | -- | |
| Baker Roberta M | $41,000 | -- | |
| Greene Stephen P | $39,900 | -- |
Source: Public Records
Mortgage History
| Date | Status | Borrower | Loan Amount |
|---|---|---|---|
| Open | Greene Stephen P | $20,000 | |
| Open | Greene Stephen P | $36,700 | |
| Closed | Greene Stephen P | $35,900 | |
| Previous Owner | Greene Stephen P | $36,900 |
Source: Public Records
Tax History
| Year | Tax Paid | Tax Assessment Tax Assessment Total Assessment is a certain percentage of the fair market value that is determined by local assessors to be the total taxable value of land and additions on the property. | Land | Improvement |
|---|---|---|---|---|
| 2025 | $3,096 | $234,700 | $0 | $234,700 |
| 2024 | $2,956 | $215,000 | $0 | $215,000 |
| 2023 | $2,634 | $183,700 | $0 | $183,700 |
| 2022 | $2,502 | $164,500 | $0 | $164,500 |
| 2021 | $2,286 | $140,400 | $0 | $140,400 |
| 2020 | $2,436 | $143,300 | $0 | $143,300 |
| 2019 | $1,850 | $102,800 | $0 | $102,800 |
| 2018 | $1,753 | $92,700 | $0 | $92,700 |
| 2017 | $1,887 | $98,200 | $0 | $98,200 |
| 2016 | $2,067 | $100,300 | $0 | $100,300 |
| 2015 | $2,013 | $100,300 | $0 | $100,300 |
| 2014 | $2,022 | $103,500 | $0 | $103,500 |
Source: Public Records
Map
Nearby Homes
- 17 Federal St Unit 210
- 531 Main St Unit 503
- 531 Main St Unit 410
- 531 Main St Unit 403
- 14 Ashland St Unit 2R
- 70 Southbridge St Unit 611
- 70 Southbridge St Unit 310
- 34 Elm St
- 10 Congress St Unit 7
- 13 West St
- 56 Elm St Unit 2
- 56 Elm St Unit 1
- 58 Elm St Unit 1
- 111 Austin St
- 709 Main St
- 146 -152 Chandler
- 21 Fruit St
- 4 Preston St
- 2 Preston St
- 38 1/2 Bowdoin St
- 27 Irving St Unit 4
- 27 Irving St Unit 3
- 27 Irving St Unit 2
- 27 Irving St Unit 1
- 6 Chatham Place Unit 8
- 6 Chatham Place Unit 7
- 6 Chatham Place
- 6 Chatham Place Unit 5
- 6 Chatham Place Unit 4
- 6 Chatham Place Unit 3
- 6 Chatham Place Unit 2
- 6 Chatham Place Unit 1
- 4 Chatham Place
- 4 Chatham Place Unit 3
- 4 Chatham Place Unit 2
- 4 Chatham Place Unit 1
- 41 Chatham St Unit 8
- 41 Chatham St Unit 6
- 41 Chatham St Unit 5
- 41 Chatham St Unit 4
Your Personal Tour Guide
Ask me questions while you tour the home.