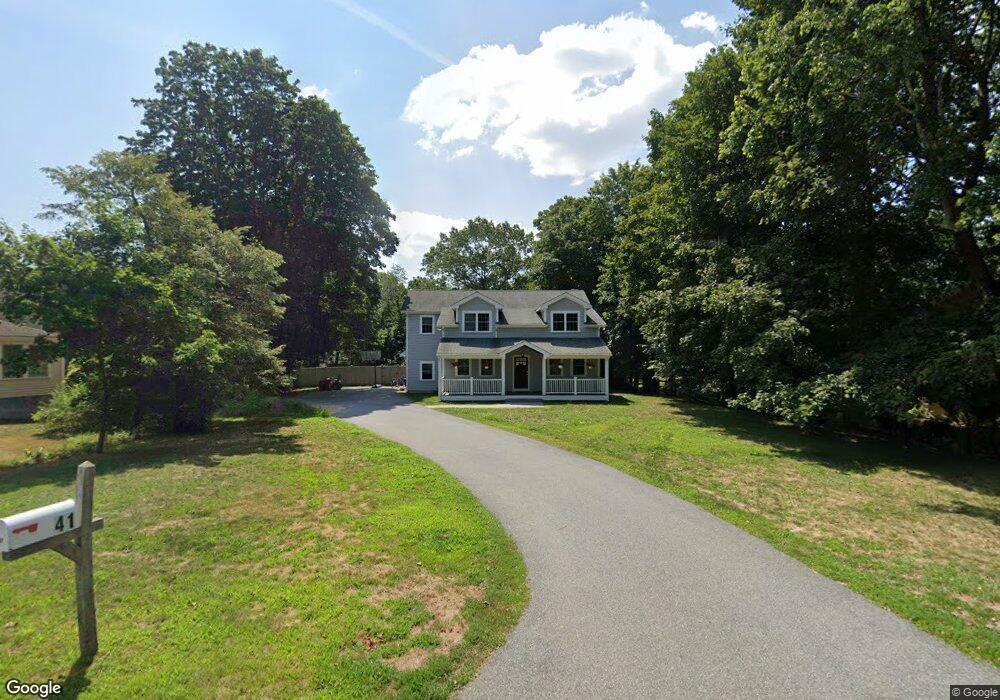
41 Cherry St Wenham, MA 01984
Estimated Value: $1,381,000 - $1,407,000
4
Beds
3
Baths
2,622
Sq Ft
$532/Sq Ft
Est. Value
About This Home
This home is located at 41 Cherry St, Wenham, MA 01984 and is currently estimated at $1,395,191, approximately $532 per square foot. 41 Cherry St is a home with nearby schools including Winthrop School, Bessie Buker Elementary School, and Cutler Elementary School.
Ownership History
Date
Name
Owned For
Owner Type
Purchase Details
Closed on
Jun 6, 2016
Sold by
Pedra John R and Pedra Jack
Bought by
Pedra Robert J
Current Estimated Value
Home Financials for this Owner
Home Financials are based on the most recent Mortgage that was taken out on this home.
Original Mortgage
$450,000
Outstanding Balance
$356,438
Interest Rate
3.59%
Mortgage Type
New Conventional
Estimated Equity
$1,038,753
Purchase Details
Closed on
Mar 4, 2016
Sold by
Campbell Frank A Est and Pedra
Bought by
Pedra Robert J
Create a Home Valuation Report for This Property
The Home Valuation Report is an in-depth analysis detailing your home's value as well as a comparison with similar homes in the area
Home Values in the Area
Average Home Value in this Area
Purchase History
| Date | Buyer | Sale Price | Title Company |
|---|---|---|---|
| Pedra Robert J | -- | -- | |
| Pedra Robert J | -- | -- | |
| Pedra Robert J | -- | -- | |
| Pedra Robert J | -- | -- | |
| Pedra Robert J | -- | -- |
Source: Public Records
Mortgage History
| Date | Status | Borrower | Loan Amount |
|---|---|---|---|
| Open | Pedra Robert J | $450,000 | |
| Closed | Pedra Robert J | $450,000 | |
| Previous Owner | Pedra Robert J | $30,000 | |
| Previous Owner | Pedra Robert J | $20,000 | |
| Previous Owner | Pedra Robert J | $7,500 |
Source: Public Records
Tax History
| Year | Tax Paid | Tax Assessment Tax Assessment Total Assessment is a certain percentage of the fair market value that is determined by local assessors to be the total taxable value of land and additions on the property. | Land | Improvement |
|---|---|---|---|---|
| 2025 | $18,737 | $1,205,700 | $558,100 | $647,600 |
| 2024 | $18,278 | $1,167,200 | $558,100 | $609,100 |
| 2023 | $18,105 | $1,043,500 | $538,400 | $505,100 |
| 2022 | $16,827 | $859,400 | $369,600 | $489,800 |
| 2021 | $16,374 | $832,000 | $342,200 | $489,800 |
| 2020 | $15,798 | $834,100 | $342,200 | $491,900 |
| 2019 | $15,030 | $834,100 | $342,200 | $491,900 |
| 2018 | $14,294 | $760,700 | $331,200 | $429,500 |
| 2017 | $6,071 | $331,200 | $331,200 | $0 |
| 2016 | $5,624 | $331,200 | $331,200 | $0 |
| 2015 | $4,895 | $301,200 | $301,200 | $0 |
Source: Public Records
Map
Nearby Homes
Your Personal Tour Guide
Ask me questions while you tour the home.