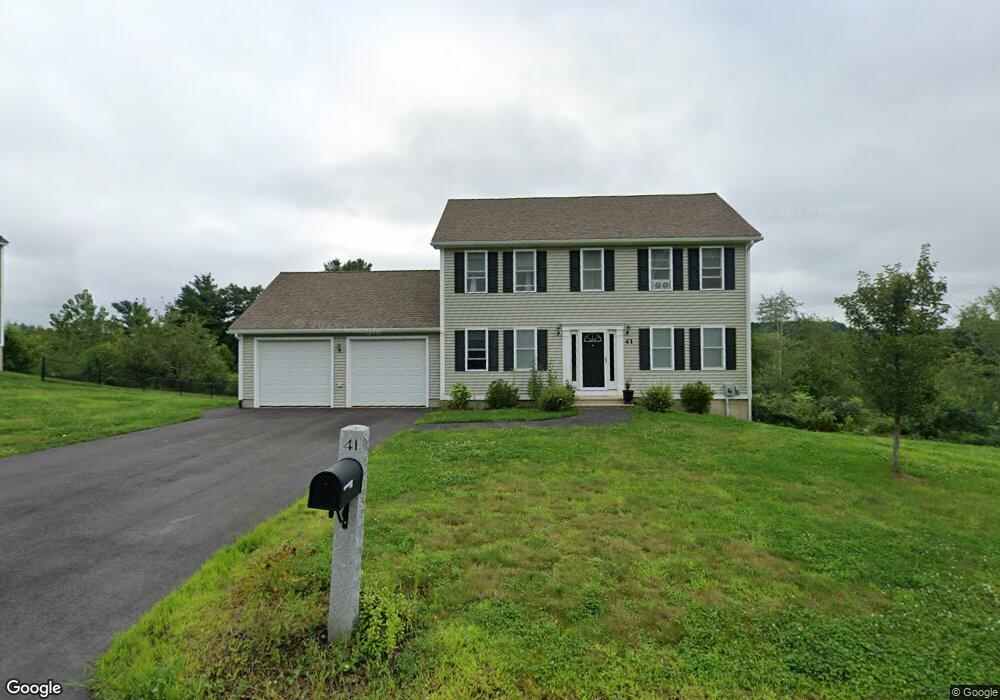
41 Clealand Cir Rutland, MA 01543
Estimated Value: $541,000 - $631,000
3
Beds
3
Baths
1,632
Sq Ft
$351/Sq Ft
Est. Value
About This Home
This home is located at 41 Clealand Cir, Rutland, MA 01543 and is currently estimated at $572,130, approximately $350 per square foot. 41 Clealand Cir is a home with nearby schools including Wachusett Regional High School.
Ownership History
Date
Name
Owned For
Owner Type
Purchase Details
Closed on
Dec 22, 2020
Sold by
Simmarano Paul V
Bought by
Simmarano Paul V and Simmarano Fay
Current Estimated Value
Home Financials for this Owner
Home Financials are based on the most recent Mortgage that was taken out on this home.
Original Mortgage
$250,000
Outstanding Balance
$222,061
Interest Rate
2.7%
Mortgage Type
New Conventional
Estimated Equity
$350,069
Purchase Details
Closed on
Nov 29, 2011
Sold by
Bear Hill Estates Llc
Bought by
Simmarano Paul V
Home Financials for this Owner
Home Financials are based on the most recent Mortgage that was taken out on this home.
Original Mortgage
$243,940
Interest Rate
3.75%
Mortgage Type
FHA
Create a Home Valuation Report for This Property
The Home Valuation Report is an in-depth analysis detailing your home's value as well as a comparison with similar homes in the area
Home Values in the Area
Average Home Value in this Area
Purchase History
| Date | Buyer | Sale Price | Title Company |
|---|---|---|---|
| Simmarano Paul V | -- | None Available | |
| Simmarano Paul V | $253,169 | -- | |
| Simmarano Paul | $253,169 | -- |
Source: Public Records
Mortgage History
| Date | Status | Borrower | Loan Amount |
|---|---|---|---|
| Open | Simmarano Paul V | $250,000 | |
| Previous Owner | Simmarano Paul | $243,940 |
Source: Public Records
Tax History Compared to Growth
Tax History
| Year | Tax Paid | Tax Assessment Tax Assessment Total Assessment is a certain percentage of the fair market value that is determined by local assessors to be the total taxable value of land and additions on the property. | Land | Improvement |
|---|---|---|---|---|
| 2025 | $6,820 | $478,900 | $118,800 | $360,100 |
| 2024 | $6,358 | $428,700 | $107,200 | $321,500 |
| 2023 | $5,784 | $421,600 | $101,000 | $320,600 |
| 2022 | $5,430 | $343,900 | $85,700 | $258,200 |
| 2021 | $5,311 | $318,000 | $85,700 | $232,300 |
| 2020 | $5,343 | $303,400 | $80,800 | $222,600 |
| 2019 | $5,263 | $294,200 | $74,000 | $220,200 |
| 2018 | $5,067 | $279,500 | $74,000 | $205,500 |
| 2017 | $5,120 | $279,500 | $74,000 | $205,500 |
| 2016 | $4,709 | $271,100 | $69,200 | $201,900 |
| 2015 | $4,653 | $263,600 | $69,200 | $194,400 |
| 2014 | $4,510 | $263,600 | $69,200 | $194,400 |
Source: Public Records
Map
Nearby Homes