Estimated Value: $738,857 - $839,000
4
Beds
3
Baths
2,850
Sq Ft
$275/Sq Ft
Est. Value
About This Home
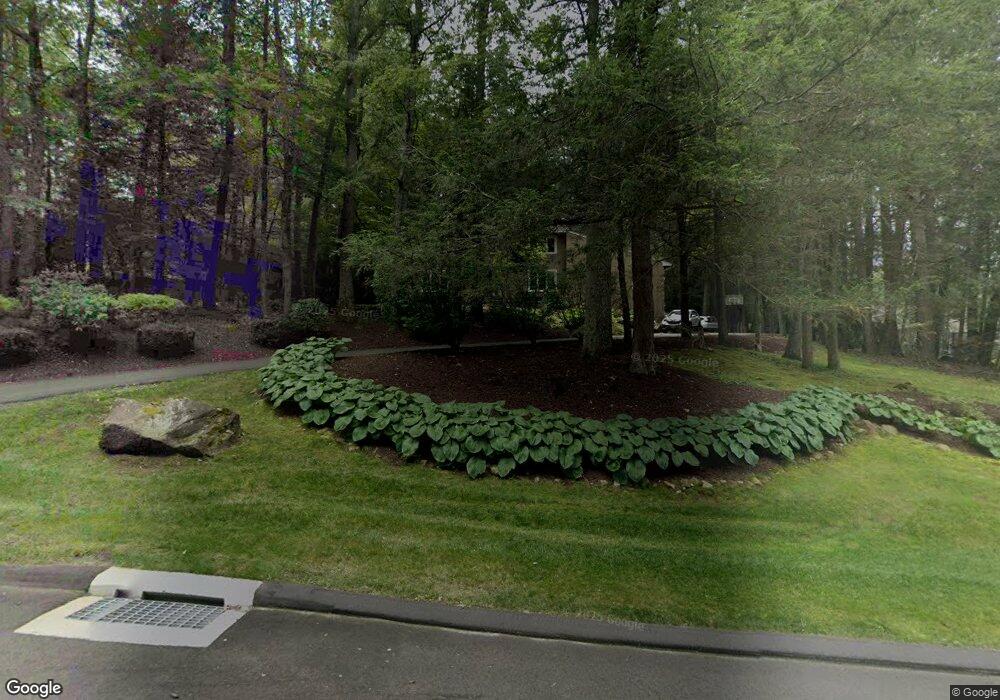
This home is located at 41 Cold Spring Rd, Avon, CT 06001 and is currently estimated at $784,214, approximately $275 per square foot. 41 Cold Spring Rd is a home located in Hartford County with nearby schools including Roaring Brook School, Thompson Brook School, and Avon Middle School.
Ownership History
Date
Name
Owned For
Owner Type
Purchase Details
Closed on
Aug 1, 2011
Sold by
Bloom Judith H
Bought by
Howard 3Rd Claude O and Howard Michelle C
Current Estimated Value
Home Financials for this Owner
Home Financials are based on the most recent Mortgage that was taken out on this home.
Original Mortgage
$409,353
Outstanding Balance
$278,107
Interest Rate
4.4%
Mortgage Type
FHA
Estimated Equity
$506,107
Purchase Details
Closed on
Jun 29, 1992
Sold by
Woods Richard and Barnett Karen
Bought by
White Jerome and White Donna
Purchase Details
Closed on
Jul 8, 1991
Sold by
Keystone Mtg Svc
Bought by
Woods Richard and Woods Karen
Create a Home Valuation Report for This Property
The Home Valuation Report is an in-depth analysis detailing your home's value as well as a comparison with similar homes in the area
Home Values in the Area
Average Home Value in this Area
Purchase History
| Date | Buyer | Sale Price | Title Company |
|---|---|---|---|
| Howard 3Rd Claude O | -- | -- | |
| Howard 3Rd Claude O | -- | -- | |
| Howard 3Rd Claude O | -- | -- | |
| White Jerome | $284,500 | -- | |
| Woods Richard | $285,000 | -- |
Source: Public Records
Mortgage History
| Date | Status | Borrower | Loan Amount |
|---|---|---|---|
| Open | Howard 3Rd Claude O | $409,353 | |
| Closed | Woods Richard | $409,353 |
Source: Public Records
Tax History
| Year | Tax Paid | Tax Assessment Tax Assessment Total Assessment is a certain percentage of the fair market value that is determined by local assessors to be the total taxable value of land and additions on the property. | Land | Improvement |
|---|---|---|---|---|
| 2025 | $11,929 | $387,950 | $122,500 | $265,450 |
| 2024 | $11,507 | $387,950 | $122,500 | $265,450 |
| 2023 | $10,328 | $291,840 | $94,500 | $197,340 |
| 2022 | $10,101 | $291,840 | $94,500 | $197,340 |
| 2021 | $9,984 | $291,840 | $94,500 | $197,340 |
| 2020 | $9,602 | $291,840 | $94,500 | $197,340 |
| 2019 | $9,602 | $291,840 | $94,500 | $197,340 |
| 2018 | $9,002 | $287,130 | $94,500 | $192,630 |
| 2017 | $8,783 | $287,130 | $94,500 | $192,630 |
| 2016 | $8,476 | $287,130 | $94,500 | $192,630 |
| 2015 | $8,269 | $287,130 | $94,500 | $192,630 |
| 2014 | $8,132 | $287,130 | $94,500 | $192,630 |
Source: Public Records
Map
Nearby Homes
- 102 Cold Spring Rd
- 30 Cliff Dr
- 4 Tanglewood Dr
- 187 W Avon Rd
- 7 Woodmont Rd
- 3 Clearwater Ct
- 26 Forest Ln
- 189 W Avon Rd
- 185 W Avon Rd
- 138 Northington Dr
- 61 Weatherstone
- 48 Weatherstone
- 58 Weatherstone
- 29 Lovely St
- 145 Hollister Dr
- 51 Westland Rd
- 40 Homestead Ln
- 7 Hadley Dr
- 7 Owl Ct Unit 7
- 95 Moravia Rd
Your Personal Tour Guide
Ask me questions while you tour the home.