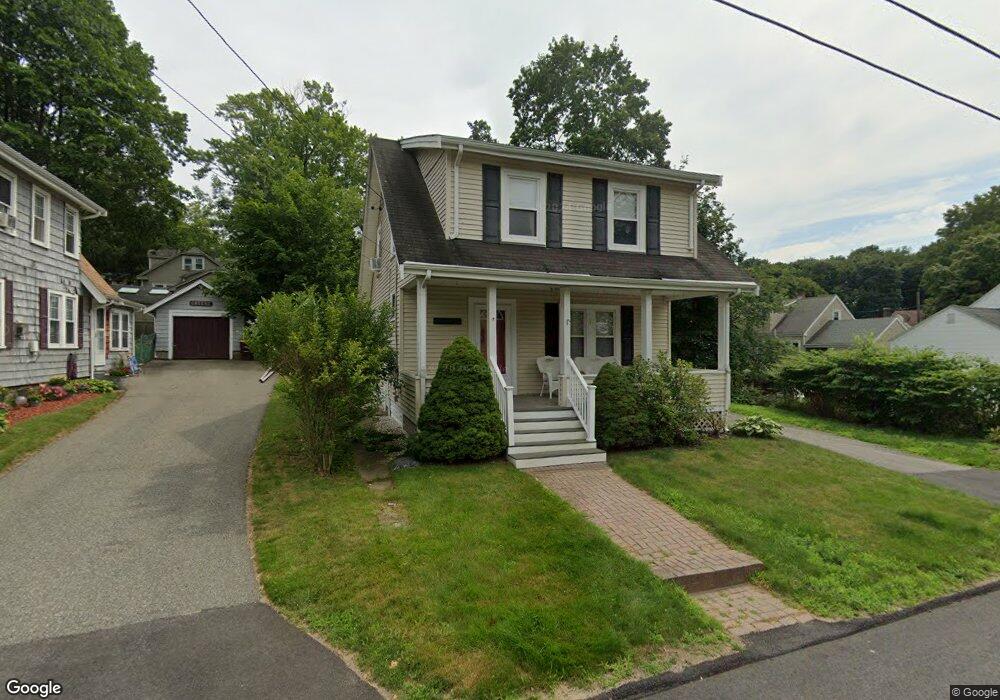
41 Cranberry Rd Weymouth, MA 02188
Weymouth Landing NeighborhoodEstimated Value: $544,531 - $601,000
3
Beds
1
Bath
1,404
Sq Ft
$412/Sq Ft
Est. Value
About This Home
This home is located at 41 Cranberry Rd, Weymouth, MA 02188 and is currently estimated at $577,883, approximately $411 per square foot. 41 Cranberry Rd is a home located in Norfolk County with nearby schools including Frederick C Murphy, Abigail Adams Middle School, and Weymouth Middle School Chapman.
Ownership History
Date
Name
Owned For
Owner Type
Purchase Details
Closed on
Dec 5, 2013
Sold by
Depalma Megan A
Bought by
Depalma Paul M
Current Estimated Value
Purchase Details
Closed on
Jan 20, 2006
Sold by
Mccarthy Dennis C and Kullen Leah A
Bought by
Depalma Paul M and Depalma Megan A
Home Financials for this Owner
Home Financials are based on the most recent Mortgage that was taken out on this home.
Original Mortgage
$264,000
Interest Rate
6.33%
Mortgage Type
Purchase Money Mortgage
Purchase Details
Closed on
Sep 19, 2003
Sold by
Cabral Lauren N and Gillis Donald E
Bought by
Kullen Leah A and Mccarthy Dennis G
Home Financials for this Owner
Home Financials are based on the most recent Mortgage that was taken out on this home.
Original Mortgage
$265,000
Interest Rate
6.31%
Mortgage Type
Purchase Money Mortgage
Create a Home Valuation Report for This Property
The Home Valuation Report is an in-depth analysis detailing your home's value as well as a comparison with similar homes in the area
Home Values in the Area
Average Home Value in this Area
Purchase History
| Date | Buyer | Sale Price | Title Company |
|---|---|---|---|
| Depalma Paul M | -- | -- | |
| Depalma Paul M | $330,000 | -- | |
| Kullen Leah A | $290,000 | -- |
Source: Public Records
Mortgage History
| Date | Status | Borrower | Loan Amount |
|---|---|---|---|
| Previous Owner | Kullen Leah A | $250,000 | |
| Previous Owner | Depalma Paul M | $264,000 | |
| Previous Owner | Depalma Paul M | $25,000 | |
| Previous Owner | Kullen Leah A | $265,000 | |
| Previous Owner | Kullen Leah A | $50,000 |
Source: Public Records
Tax History
| Year | Tax Paid | Tax Assessment Tax Assessment Total Assessment is a certain percentage of the fair market value that is determined by local assessors to be the total taxable value of land and additions on the property. | Land | Improvement |
|---|---|---|---|---|
| 2025 | $4,923 | $487,400 | $216,200 | $271,200 |
| 2024 | $4,771 | $464,600 | $205,900 | $258,700 |
| 2023 | $4,604 | $440,600 | $190,600 | $250,000 |
| 2022 | $4,505 | $393,100 | $176,500 | $216,600 |
| 2021 | $4,150 | $353,500 | $176,500 | $177,000 |
| 2020 | $3,961 | $332,300 | $176,500 | $155,800 |
| 2019 | $3,869 | $319,200 | $169,700 | $149,500 |
| 2018 | $3,760 | $300,800 | $161,600 | $139,200 |
| 2017 | $3,582 | $279,600 | $154,000 | $125,600 |
| 2016 | $3,442 | $268,900 | $148,100 | $120,800 |
| 2015 | $3,255 | $252,300 | $141,300 | $111,000 |
| 2014 | $3,128 | $235,200 | $131,500 | $103,700 |
Source: Public Records
Map
Nearby Homes
- 46 Roosevelt Rd
- 19 Vine St Unit 2
- 25 Richmond St
- 211 Roosevelt Rd
- 11 Richmond St
- 122 Washington St Unit Twenty-two
- 16 Beechwood Rd
- 70 Biscayne Ave
- 15 Summer St
- 33 Congress St
- 54 Edgemont Rd
- 49 Cornish St
- 37 Lantern Ln
- 41 Lantern Ln
- 47 Academy Ave
- 70 Colonial Rd
- 78 Middle St
- 312 Shaw St
- 148 Chard St
- 270 Middle St
Your Personal Tour Guide
Ask me questions while you tour the home.