41 Crescent Ave Griffin, GA 30223
Spalding County NeighborhoodEstimated Value: $78,000 - $95,432
2
Beds
1
Bath
1,312
Sq Ft
$66/Sq Ft
Est. Value
About This Home
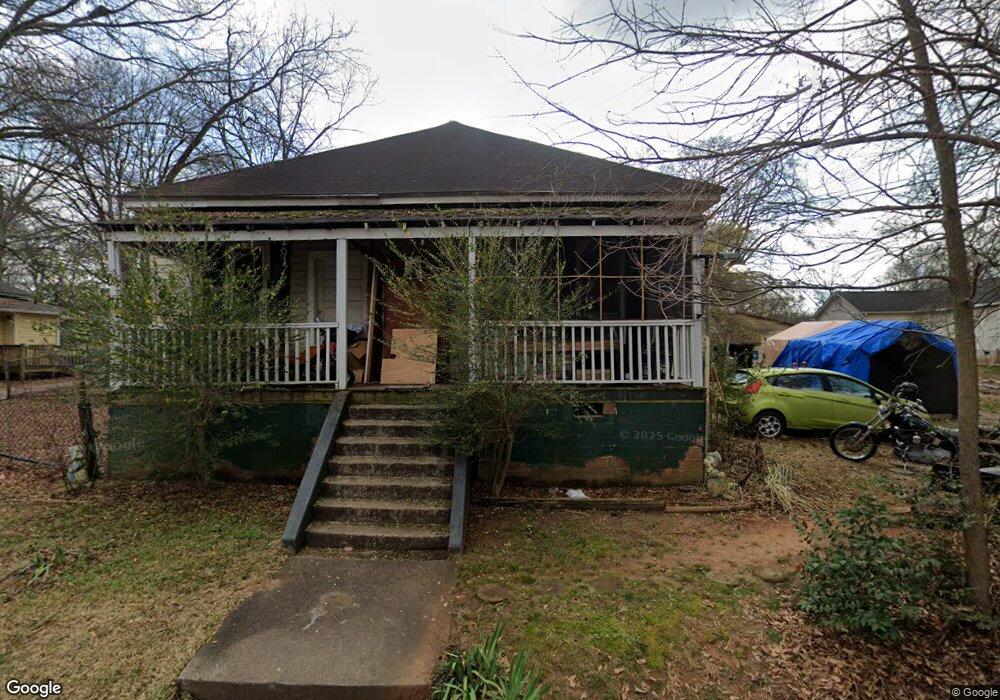
This home is located at 41 Crescent Ave, Griffin, GA 30223 and is currently estimated at $87,108, approximately $66 per square foot. 41 Crescent Ave is a home located in Spalding County with nearby schools including Futral Road Elementary School, Rehoboth Road Middle School, and Spalding High School.
Ownership History
Date
Name
Owned For
Owner Type
Purchase Details
Closed on
Jun 20, 2019
Sold by
Bailey Lonnie Gerald
Bought by
Lewis Sandy
Current Estimated Value
Purchase Details
Closed on
Mar 13, 2009
Sold by
Nationstar Mtg Llc
Bought by
Bailey Lonnie G
Purchase Details
Closed on
Apr 1, 2008
Sold by
Sorrow Joseph and Sorrow Brenda
Bought by
Nationstar Mtg Llc
Purchase Details
Closed on
Dec 12, 1977
Sold by
Central Lake Church Of God
Bought by
Wilson Jerry W and Wilson Brenda D
Purchase Details
Closed on
May 29, 1974
Sold by
Oneal Bobby Lamar
Bought by
Central Lake Church Of God
Purchase Details
Closed on
Feb 13, 1973
Sold by
Oneal James M
Bought by
Oneal Bobby Lamar
Purchase Details
Closed on
Oct 23, 1972
Sold by
Oneal Bobby Lamar
Bought by
Oneal James M
Purchase Details
Closed on
Jul 23, 1971
Sold by
Mccullough Bobby S
Bought by
Oneal Bobby Lamar
Purchase Details
Closed on
Nov 2, 1968
Sold by
Woodle John B
Bought by
Mccullough Bobby S
Purchase Details
Closed on
Jul 17, 1963
Bought by
Woodle John B
Create a Home Valuation Report for This Property
The Home Valuation Report is an in-depth analysis detailing your home's value as well as a comparison with similar homes in the area
Home Values in the Area
Average Home Value in this Area
Purchase History
| Date | Buyer | Sale Price | Title Company |
|---|---|---|---|
| Lewis Sandy | $30,000 | -- | |
| Bailey Lonnie G | $16,800 | -- | |
| Nationstar Mtg Llc | $49,075 | -- | |
| Wilson Jerry W | $10,000 | -- | |
| Central Lake Church Of God | $8,400 | -- | |
| Oneal Bobby Lamar | -- | -- | |
| Oneal James M | $5,700 | -- | |
| Oneal Bobby Lamar | $5,000 | -- | |
| Mccullough Bobby S | $1,400 | -- | |
| Woodle John B | $4,400 | -- |
Source: Public Records
Tax History Compared to Growth
Tax History
| Year | Tax Paid | Tax Assessment Tax Assessment Total Assessment is a certain percentage of the fair market value that is determined by local assessors to be the total taxable value of land and additions on the property. | Land | Improvement |
|---|---|---|---|---|
| 2024 | $315 | $10,612 | $2,880 | $7,732 |
| 2023 | $315 | $10,612 | $2,880 | $7,732 |
| 2022 | $359 | $11,692 | $2,700 | $8,992 |
| 2021 | $326 | $10,776 | $2,700 | $8,076 |
| 2020 | $327 | $10,776 | $2,700 | $8,076 |
| 2019 | $401 | $10,776 | $2,700 | $8,076 |
| 2018 | $379 | $9,928 | $2,700 | $7,228 |
| 2017 | $369 | $9,928 | $2,700 | $7,228 |
| 2016 | $376 | $9,928 | $2,700 | $7,228 |
| 2015 | $387 | $9,928 | $2,700 | $7,228 |
| 2014 | $395 | $9,928 | $2,700 | $7,228 |
Source: Public Records
Map
Nearby Homes
- 512 Searcy Ave
- 8 RENTALS HOUSE 712 Searcy Ave
- 1765 High Falls Rd
- 251 Lang St
- 108 Jackson Ln
- 831 Bel Air Cir
- 821 Bel Air Cir
- 911 Clayton St
- 170 Jackson Ln
- 917 E Broadway St
- 406 Pinelea Rd
- 505 Kincaid Ave
- 524 Kincaid Ave
- 945 Finley St
- 727 E Slaton Ave
- 941 Springer Dr
- 362 Rehoboth Rd
- 303 E Broadway St
- 320 Morris St
- 203 N 1st St
- 43 Crescent Ave
- 51 Park Ave
- 50 Park Ave
- 53 Park Ave
- 89 Crescent Ave
- 87 Crescent Ave
- 45 Crescent Ave
- 55 Park Ave
- 85 Crescent Ave
- 31 Cascade Ave Unit 94
- 31 Cascade Ave
- 30 Cascade Ave
- 48 Crescent Ave
- 36 Cascade Ave
- 27 Cascade Ave
- 59 Park Ave
- 91 Crescent Ave
- 0 Cascade Ave Unit 8719085
- 0 Cascade Ave Unit 8673404
- 0 Cascade Ave Unit 8322813