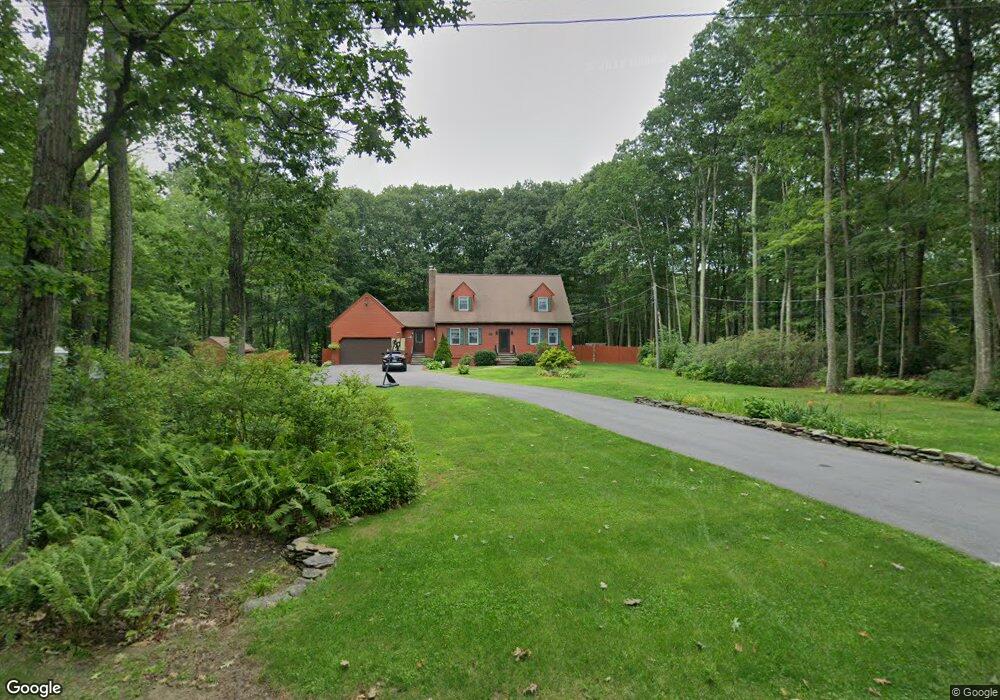
41 Crystal St Paxton, MA 01612
Estimated Value: $644,613 - $678,000
3
Beds
3
Baths
2,220
Sq Ft
$295/Sq Ft
Est. Value
About This Home
This home is located at 41 Crystal St, Paxton, MA 01612 and is currently estimated at $655,403, approximately $295 per square foot. 41 Crystal St is a home located in Worcester County with nearby schools including Wachusett Regional High School and Worcester Seventh-Day Adventist School.
Ownership History
Date
Name
Owned For
Owner Type
Purchase Details
Closed on
Nov 1, 1999
Sold by
Byrnes Carole A
Bought by
Quinn James P and Quinn Karen S
Current Estimated Value
Home Financials for this Owner
Home Financials are based on the most recent Mortgage that was taken out on this home.
Original Mortgage
$150,000
Interest Rate
7.78%
Mortgage Type
Purchase Money Mortgage
Purchase Details
Closed on
Jul 19, 1988
Sold by
Robinson Richard J
Bought by
Crowley D M
Create a Home Valuation Report for This Property
The Home Valuation Report is an in-depth analysis detailing your home's value as well as a comparison with similar homes in the area
Home Values in the Area
Average Home Value in this Area
Purchase History
| Date | Buyer | Sale Price | Title Company |
|---|---|---|---|
| Quinn James P | $218,500 | -- | |
| Crowley D M | $226,115 | -- |
Source: Public Records
Mortgage History
| Date | Status | Borrower | Loan Amount |
|---|---|---|---|
| Open | Crowley D M | $232,000 | |
| Closed | Crowley D M | $160,000 | |
| Closed | Crowley D M | $150,000 |
Source: Public Records
Tax History Compared to Growth
Tax History
| Year | Tax Paid | Tax Assessment Tax Assessment Total Assessment is a certain percentage of the fair market value that is determined by local assessors to be the total taxable value of land and additions on the property. | Land | Improvement |
|---|---|---|---|---|
| 2025 | $7,594 | $515,200 | $134,900 | $380,300 |
| 2024 | $7,167 | $446,000 | $134,900 | $311,100 |
| 2023 | $7,278 | $414,000 | $124,700 | $289,300 |
| 2022 | $7,055 | $371,700 | $124,700 | $247,000 |
| 2021 | $14,190 | $360,400 | $115,700 | $244,700 |
| 2020 | $13,692 | $352,000 | $107,300 | $244,700 |
| 2019 | $5,280 | $344,200 | $99,500 | $244,700 |
| 2018 | $12,194 | $314,700 | $92,700 | $222,000 |
| 2017 | $6,345 | $311,200 | $89,000 | $222,200 |
| 2016 | $6,134 | $297,900 | $89,000 | $208,900 |
| 2015 | $5,950 | $286,200 | $89,000 | $197,200 |
| 2014 | $5,786 | $282,100 | $89,700 | $192,400 |
Source: Public Records
Map
Nearby Homes