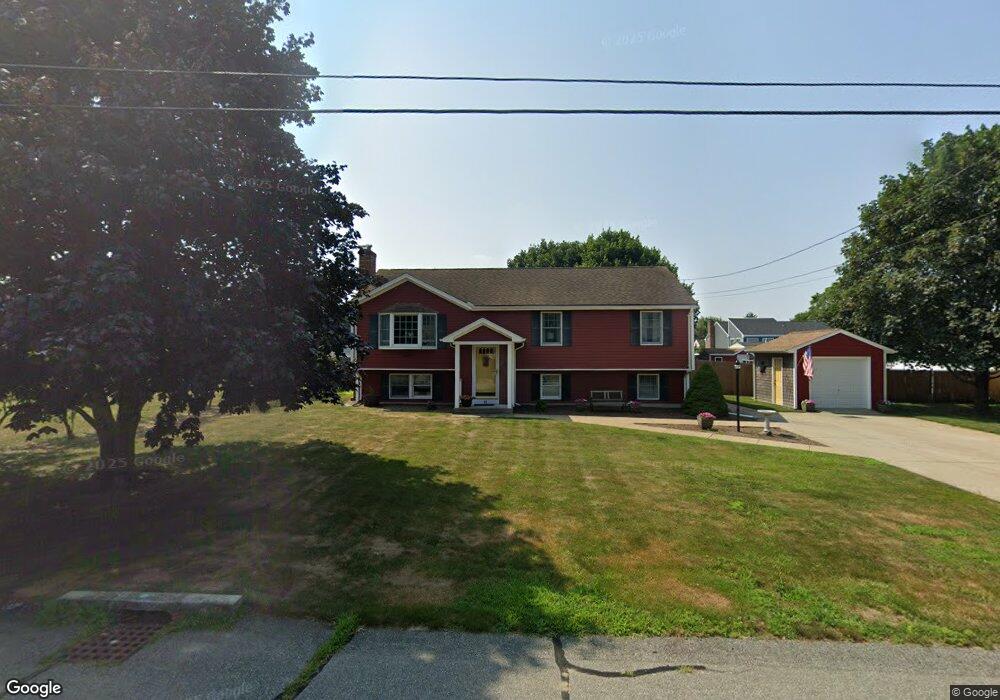
41 Del jo Dr Seekonk, MA 02771
Estimated Value: $544,000 - $607,000
3
Beds
2
Baths
1,165
Sq Ft
$491/Sq Ft
Est. Value
About This Home
This home is located at 41 Del jo Dr, Seekonk, MA 02771 and is currently estimated at $571,540, approximately $490 per square foot. 41 Del jo Dr is a home located in Bristol County with nearby schools including Seekonk High School, The Gordon School, and St Mary Academy-Bay View.
Ownership History
Date
Name
Owned For
Owner Type
Purchase Details
Closed on
Apr 29, 1996
Sold by
Botelho Anatero A and Botelho Goretti R
Bought by
Sthilaire Arthur J and Sthilaire Kimberly A
Current Estimated Value
Purchase Details
Closed on
Jun 23, 1989
Sold by
Heritage Home-Attle
Bought by
Botelho Antero A
Create a Home Valuation Report for This Property
The Home Valuation Report is an in-depth analysis detailing your home's value as well as a comparison with similar homes in the area
Home Values in the Area
Average Home Value in this Area
Purchase History
| Date | Buyer | Sale Price | Title Company |
|---|---|---|---|
| Sthilaire Arthur J | $133,000 | -- | |
| Botelho Antero A | $146,900 | -- |
Source: Public Records
Mortgage History
| Date | Status | Borrower | Loan Amount |
|---|---|---|---|
| Open | Botelho Antero A | $142,724 | |
| Closed | Botelho Antero A | $95,000 | |
| Closed | Botelho Antero A | $30,000 |
Source: Public Records
Tax History Compared to Growth
Tax History
| Year | Tax Paid | Tax Assessment Tax Assessment Total Assessment is a certain percentage of the fair market value that is determined by local assessors to be the total taxable value of land and additions on the property. | Land | Improvement |
|---|---|---|---|---|
| 2025 | $5,774 | $467,500 | $157,900 | $309,600 |
| 2024 | $5,545 | $449,000 | $157,900 | $291,100 |
| 2023 | $5,375 | $410,000 | $141,300 | $268,700 |
| 2022 | $4,693 | $365,000 | $135,600 | $229,400 |
| 2021 | $4,693 | $345,800 | $120,400 | $225,400 |
| 2020 | $4,537 | $344,500 | $120,100 | $224,400 |
| 2019 | $4,383 | $335,600 | $120,100 | $215,500 |
| 2018 | $4,297 | $321,900 | $120,100 | $201,800 |
| 2017 | $4,061 | $301,700 | $114,900 | $186,800 |
| 2016 | $3,989 | $297,500 | $114,900 | $182,600 |
| 2015 | $3,898 | $294,600 | $114,900 | $179,700 |
Source: Public Records
Map
Nearby Homes