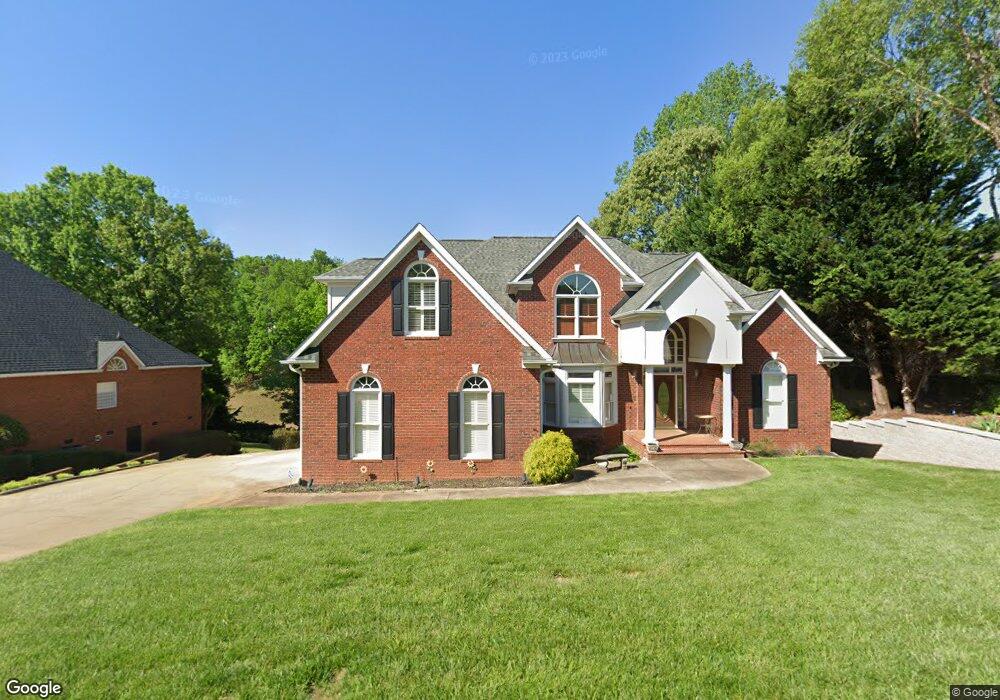
41 Devonhall Way Taylors, SC 29687
Estimated Value: $867,000 - $939,076
5
Beds
5
Baths
5,332
Sq Ft
$169/Sq Ft
Est. Value
About This Home
This home is located at 41 Devonhall Way, Taylors, SC 29687 and is currently estimated at $902,019, approximately $169 per square foot. 41 Devonhall Way is a home located in Greenville County with nearby schools including Paris Elementary School, Sevier Middle, and Wade Hampton High.
Ownership History
Date
Name
Owned For
Owner Type
Purchase Details
Closed on
Jan 14, 2021
Sold by
Sigmon Colen G and Signmon Martha B
Bought by
Sigmon Colen G and Sigmon Martha B
Current Estimated Value
Home Financials for this Owner
Home Financials are based on the most recent Mortgage that was taken out on this home.
Original Mortgage
$315,000
Outstanding Balance
$230,317
Interest Rate
2.71%
Mortgage Type
New Conventional
Estimated Equity
$671,702
Purchase Details
Closed on
Sep 29, 2016
Sold by
Brausch Dolores
Bought by
Signmon Colen G and Signmon Martha D
Purchase Details
Closed on
Oct 3, 2005
Sold by
Brausch John
Bought by
Brausch Dolores
Purchase Details
Closed on
Mar 23, 1999
Sold by
Edward Bldrs Inc
Bought by
Brausch John
Purchase Details
Closed on
Dec 31, 1998
Sold by
L P C Of S C Inc
Bought by
Edwards Bldrs Inc
Create a Home Valuation Report for This Property
The Home Valuation Report is an in-depth analysis detailing your home's value as well as a comparison with similar homes in the area
Home Values in the Area
Average Home Value in this Area
Purchase History
| Date | Buyer | Sale Price | Title Company |
|---|---|---|---|
| Sigmon Colen G | -- | None Available | |
| Signmon Colen G | $451,000 | Title To Real Estate | |
| Brausch Dolores | -- | -- | |
| Brausch John | $48,000 | -- | |
| Edwards Bldrs Inc | $48,000 | -- |
Source: Public Records
Mortgage History
| Date | Status | Borrower | Loan Amount |
|---|---|---|---|
| Open | Sigmon Colen G | $315,000 |
Source: Public Records
Tax History Compared to Growth
Tax History
| Year | Tax Paid | Tax Assessment Tax Assessment Total Assessment is a certain percentage of the fair market value that is determined by local assessors to be the total taxable value of land and additions on the property. | Land | Improvement |
|---|---|---|---|---|
| 2024 | $3,936 | $21,620 | $2,290 | $19,330 |
| 2023 | $3,726 | $21,620 | $2,290 | $19,330 |
| 2022 | $3,636 | $21,620 | $2,290 | $19,330 |
| 2021 | $3,569 | $21,620 | $2,290 | $19,330 |
| 2020 | $3,219 | $18,800 | $2,080 | $16,720 |
| 2019 | $3,187 | $18,800 | $2,080 | $16,720 |
| 2018 | $3,303 | $18,800 | $2,080 | $16,720 |
| 2017 | $3,270 | $18,800 | $2,080 | $16,720 |
| 2016 | $3,149 | $470,060 | $52,000 | $418,060 |
| 2015 | $3,115 | $470,060 | $52,000 | $418,060 |
| 2014 | $2,951 | $452,760 | $60,000 | $392,760 |
Source: Public Records
Map
Nearby Homes
- 305 Beckworth Dr
- 8 Overlook Ct
- 504 Cypress Links Way
- 301 Cardinal Dr
- 8 Knoll Cir
- 1810 Reid School Rd
- 6 Apple Jack Ln
- 10 Kindlin Way
- 29 Kindlin Way
- 1863 Reid School Rd
- 1861 Reid School Rd
- 1859 Reid School Rd
- 2 Cauley Dr Unit 30
- 3 Fox Ridge Point
- 585 Mountain Creek Rd
- 430 Tanyard Rd
- 4417 State Park Rd
- 302 Ledgewood Way
- 120 Beaumont Creek Ln
- 102 Millbrook Cir
- 45 Devonhall Way
- 37 Devonhall Way
- 49 Devonhall Way
- 33 Devonhall Way
- 50 Devonhall Way
- 34 Devonhall Way
- 51 Devonhall Way
- 29 Devonhall Way
- 38 Devonhall Way
- 46 Devonhall Way
- 42 Devonhall Way
- 54 Devonhall Way
- 32 Devonhall Way
- 55 Devonhall Way
- 25 Devonhall Way
- 58 Devonhall Way
- 28 Devonhall Way
- 408 Beckworth Dr
- 412 Beckworth Dr
- 404 Beckworth Dr