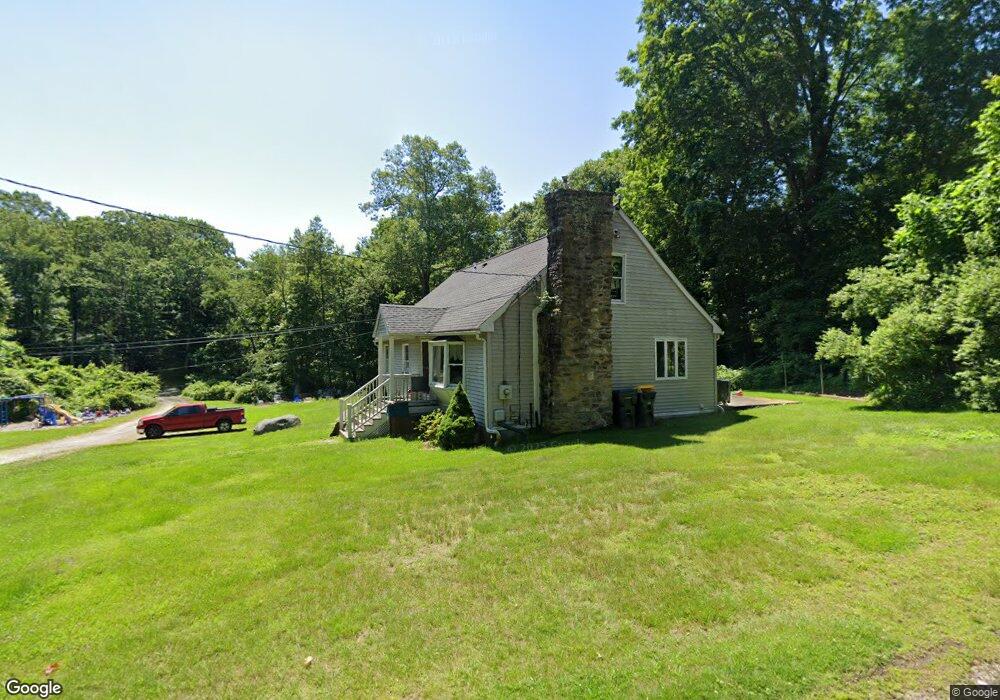
41 Dorman Rd Oxford, CT 06478
Estimated Value: $444,000 - $548,000
4
Beds
2
Baths
1,716
Sq Ft
$289/Sq Ft
Est. Value
About This Home
This home is located at 41 Dorman Rd, Oxford, CT 06478 and is currently estimated at $495,295, approximately $288 per square foot. 41 Dorman Rd is a home located in New Haven County with nearby schools including Quaker Farms School, Oxford Middle School, and Oxford High School.
Ownership History
Date
Name
Owned For
Owner Type
Purchase Details
Closed on
Jun 25, 2021
Sold by
Second St Const Llc
Bought by
Micherino Shane
Current Estimated Value
Home Financials for this Owner
Home Financials are based on the most recent Mortgage that was taken out on this home.
Original Mortgage
$294,566
Outstanding Balance
$267,273
Interest Rate
2.9%
Mortgage Type
FHA
Estimated Equity
$228,022
Purchase Details
Closed on
Mar 15, 2018
Sold by
Naughton James A
Bought by
2Nd Street Const
Purchase Details
Closed on
Feb 27, 1985
Bought by
Naughton James and Naughton Nancy
Create a Home Valuation Report for This Property
The Home Valuation Report is an in-depth analysis detailing your home's value as well as a comparison with similar homes in the area
Home Values in the Area
Average Home Value in this Area
Purchase History
| Date | Buyer | Sale Price | Title Company |
|---|---|---|---|
| Micherino Shane | $300,000 | None Available | |
| Micherino Shane | $300,000 | None Available | |
| Micherino Shane | $300,000 | None Available | |
| 2Nd Street Const | $137,780 | -- | |
| 2Nd Street Const | $137,780 | -- | |
| Naughton James | -- | -- | |
| 2Nd Street Const | $137,780 | -- |
Source: Public Records
Mortgage History
| Date | Status | Borrower | Loan Amount |
|---|---|---|---|
| Open | Micherino Shane | $294,566 | |
| Closed | Micherino Shane | $294,566 | |
| Previous Owner | Naughton James | $74,700 |
Source: Public Records
Tax History Compared to Growth
Tax History
| Year | Tax Paid | Tax Assessment Tax Assessment Total Assessment is a certain percentage of the fair market value that is determined by local assessors to be the total taxable value of land and additions on the property. | Land | Improvement |
|---|---|---|---|---|
| 2025 | $4,842 | $241,990 | $69,650 | $172,340 |
| 2024 | $4,950 | $191,800 | $71,200 | $120,600 |
| 2023 | $4,701 | $191,800 | $71,200 | $120,600 |
| 2022 | $4,672 | $191,800 | $71,200 | $120,600 |
| 2021 | $4,287 | $186,400 | $71,200 | $115,200 |
| 2020 | $4,229 | $177,400 | $71,200 | $106,200 |
| 2019 | $4,229 | $177,400 | $71,200 | $106,200 |
| 2018 | $4,089 | $177,400 | $71,200 | $106,200 |
| 2017 | $3,940 | $177,400 | $71,200 | $106,200 |
| 2016 | $4,295 | $177,400 | $71,200 | $106,200 |
| 2015 | $4,513 | $180,800 | $71,200 | $109,600 |
| 2014 | $4,496 | $180,800 | $71,200 | $109,600 |
Source: Public Records
Map
Nearby Homes