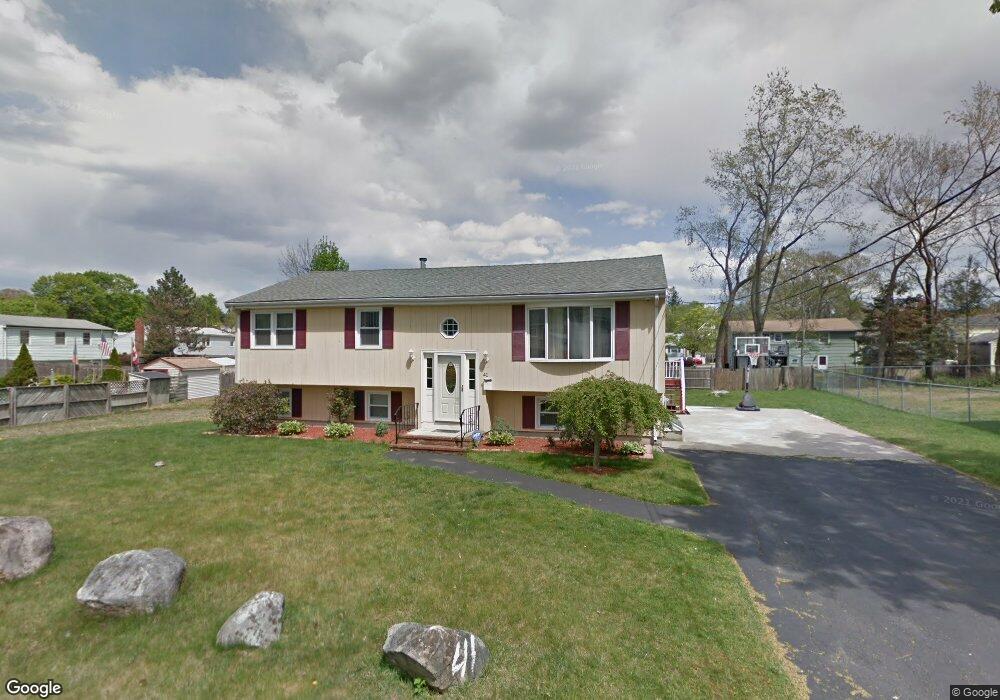
41 Douglas Ave Brockton, MA 02302
Montello NeighborhoodEstimated Value: $506,479 - $638,000
3
Beds
1
Bath
1,672
Sq Ft
$334/Sq Ft
Est. Value
About This Home
This home is located at 41 Douglas Ave, Brockton, MA 02302 and is currently estimated at $557,620, approximately $333 per square foot. 41 Douglas Ave is a home located in Plymouth County with nearby schools including Brookfield Elementary School, Mary E. Baker Elementary School, and Downey Elementary School.
Ownership History
Date
Name
Owned For
Owner Type
Purchase Details
Closed on
Jun 6, 2003
Sold by
Teixeira Manuel and Teixeira Adelina
Bought by
Pires Renaldo J and Monterio Fatima P
Current Estimated Value
Purchase Details
Closed on
Mar 14, 1989
Sold by
Friends Enterpr Dev
Bought by
Lizarralde Edgar
Create a Home Valuation Report for This Property
The Home Valuation Report is an in-depth analysis detailing your home's value as well as a comparison with similar homes in the area
Home Values in the Area
Average Home Value in this Area
Purchase History
| Date | Buyer | Sale Price | Title Company |
|---|---|---|---|
| Pires Renaldo J | $257,000 | -- | |
| Lizarralde Edgar | $91,500 | -- |
Source: Public Records
Mortgage History
| Date | Status | Borrower | Loan Amount |
|---|---|---|---|
| Open | Lizarralde Edgar | $248,270 | |
| Closed | Lizarralde Edgar | $251,000 | |
| Closed | Lizarralde Edgar | $248,675 | |
| Closed | Lizarralde Edgar | $243,600 |
Source: Public Records
Tax History
| Year | Tax Paid | Tax Assessment Tax Assessment Total Assessment is a certain percentage of the fair market value that is determined by local assessors to be the total taxable value of land and additions on the property. | Land | Improvement |
|---|---|---|---|---|
| 2025 | $5,749 | $474,700 | $164,500 | $310,200 |
| 2024 | $5,635 | $468,800 | $164,500 | $304,300 |
| 2023 | $5,397 | $415,800 | $115,000 | $300,800 |
| 2022 | $5,296 | $379,100 | $104,500 | $274,600 |
| 2021 | $5,136 | $354,200 | $98,400 | $255,800 |
| 2020 | $4,780 | $315,500 | $85,800 | $229,700 |
| 2019 | $4,712 | $303,200 | $82,500 | $220,700 |
| 2018 | $4,690 | $292,000 | $82,500 | $209,500 |
| 2017 | $4,004 | $248,700 | $82,500 | $166,200 |
| 2016 | $4,106 | $236,500 | $78,600 | $157,900 |
| 2015 | $3,890 | $214,300 | $78,600 | $135,700 |
| 2014 | $3,965 | $218,700 | $78,600 | $140,100 |
Source: Public Records
Map
Nearby Homes
Your Personal Tour Guide
Ask me questions while you tour the home.