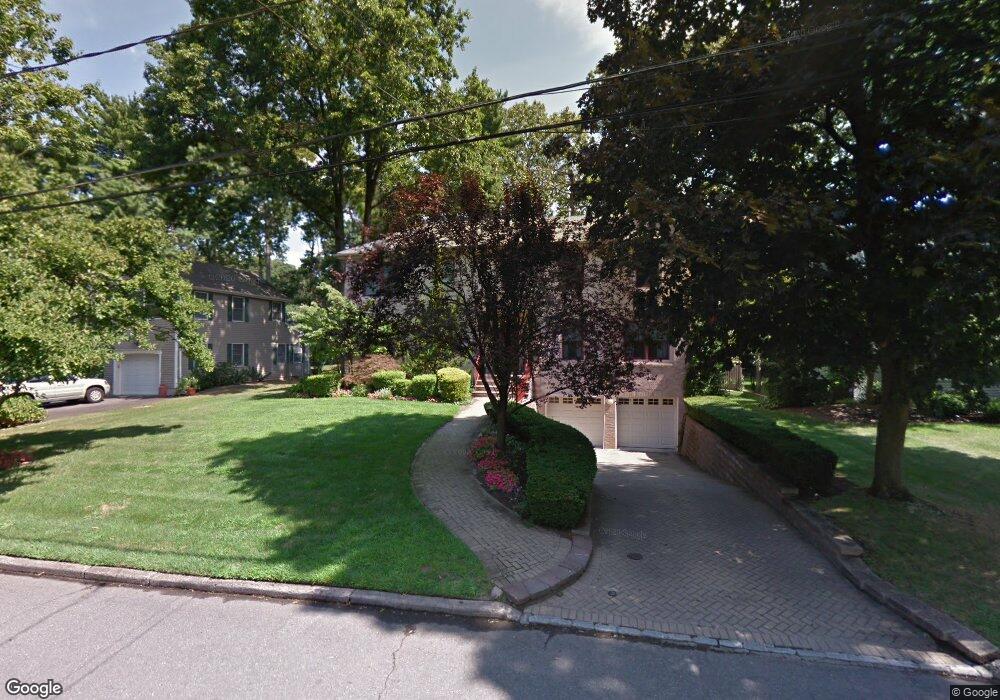
41 Downey Dr Tenafly, NJ 07670
Estimated Value: $2,017,622 - $2,248,000
4
Beds
4
Baths
3,092
Sq Ft
$681/Sq Ft
Est. Value
About This Home
This home is located at 41 Downey Dr, Tenafly, NJ 07670 and is currently estimated at $2,107,156, approximately $681 per square foot. 41 Downey Dr is a home located in Bergen County with nearby schools including Tenafly Middle School, Tenafly High School, and Academy of Our Lady of Mount Carmel.
Ownership History
Date
Name
Owned For
Owner Type
Purchase Details
Closed on
Aug 28, 2023
Sold by
Rosenberg Marc and Rosenberg Lauren
Bought by
Stein Gonen and Waismel-Stein Shani Fani
Current Estimated Value
Purchase Details
Closed on
May 16, 2003
Sold by
Roman Ron
Bought by
Rosenberg Marc and Rosenberg Lauren
Home Financials for this Owner
Home Financials are based on the most recent Mortgage that was taken out on this home.
Original Mortgage
$300,000
Interest Rate
5.86%
Purchase Details
Closed on
Nov 24, 1997
Sold by
Homeplan Inc
Bought by
Roman Ron and Roman Jane
Home Financials for this Owner
Home Financials are based on the most recent Mortgage that was taken out on this home.
Original Mortgage
$400,000
Interest Rate
7.37%
Purchase Details
Closed on
Jun 13, 1997
Sold by
Rapaport Uri and Rapaport Tamar
Bought by
Homeplan Inc
Purchase Details
Closed on
Mar 7, 1997
Sold by
Alton Alice
Bought by
Rapaport Uri and Rapaport Tamar
Create a Home Valuation Report for This Property
The Home Valuation Report is an in-depth analysis detailing your home's value as well as a comparison with similar homes in the area
Home Values in the Area
Average Home Value in this Area
Purchase History
| Date | Buyer | Sale Price | Title Company |
|---|---|---|---|
| Stein Gonen | $1,762,000 | Chicago Title | |
| Stein Gonen | $1,762,000 | Chicago Title | |
| Rosenberg Marc | $910,000 | -- | |
| Roman Ron | $625,000 | -- | |
| Homeplan Inc | $208,000 | -- | |
| Rapaport Uri | $260,000 | -- |
Source: Public Records
Mortgage History
| Date | Status | Borrower | Loan Amount |
|---|---|---|---|
| Previous Owner | Rosenberg Marc | $300,000 | |
| Previous Owner | Roman Ron | $400,000 |
Source: Public Records
Tax History Compared to Growth
Tax History
| Year | Tax Paid | Tax Assessment Tax Assessment Total Assessment is a certain percentage of the fair market value that is determined by local assessors to be the total taxable value of land and additions on the property. | Land | Improvement |
|---|---|---|---|---|
| 2025 | $31,984 | $1,125,800 | $510,000 | $615,800 |
| 2024 | $31,207 | $1,125,800 | $510,000 | $615,800 |
| 2023 | $30,453 | $1,125,800 | $510,000 | $615,800 |
| 2022 | $30,453 | $1,125,800 | $510,000 | $615,800 |
| 2021 | $29,913 | $1,125,800 | $510,000 | $615,800 |
| 2020 | $29,473 | $1,125,800 | $510,000 | $615,800 |
| 2019 | $28,956 | $1,125,800 | $510,000 | $615,800 |
| 2018 | $28,505 | $1,125,800 | $510,000 | $615,800 |
| 2017 | $28,404 | $1,125,800 | $510,000 | $615,800 |
| 2016 | $27,841 | $1,125,800 | $510,000 | $615,800 |
| 2015 | $27,222 | $1,125,800 | $510,000 | $615,800 |
| 2014 | $26,715 | $1,105,200 | $510,000 | $595,200 |
Source: Public Records
Map
Nearby Homes
- 29 Woodland Park Dr
- 162 Elm St
- 84 Howard Park Dr
- 12 Westervelt Ave
- 20 Westervelt Ave
- 136 Stonehurst Dr
- 109 Stonehurst Dr
- 121 Churchill Rd
- 51 W Hudson Ave Unit 16
- 54 Westervelt Ave Unit B
- 22 Old Smith Rd
- 63 W Hudson Ave Unit C5
- 76 Franklin St Unit B
- 158 Oxford Dr
- 468 Lydecker St
- 57 George St
- 48 Windsor Rd
- 67 Forest Rd
- 53 Hamilton Place
- 55 Ridge Rd