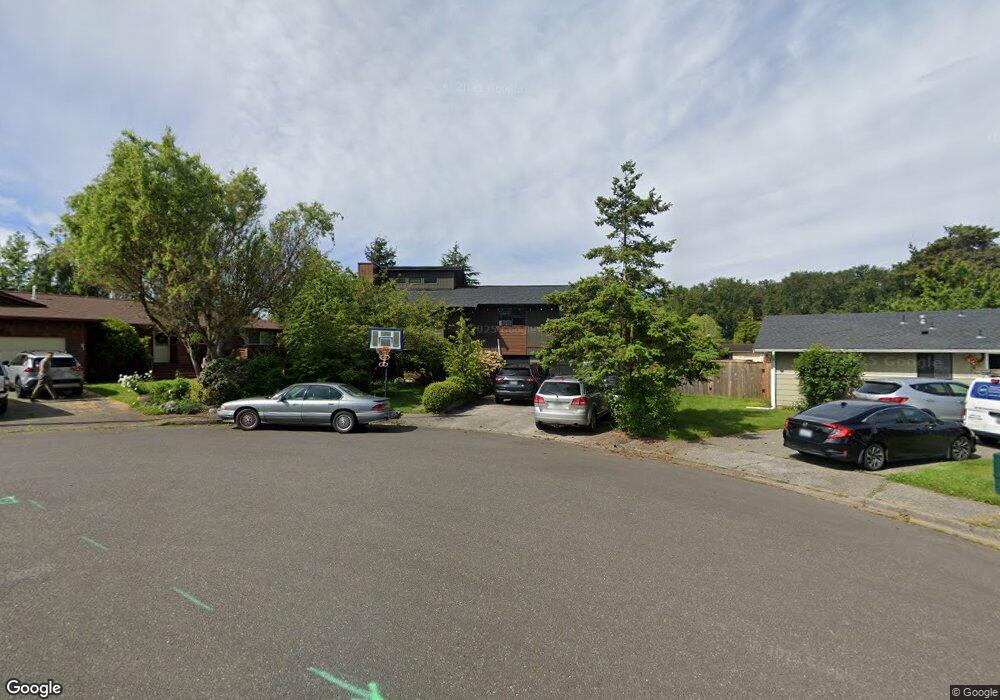
41 Drayton Ct Blaine, WA 98230
Estimated Value: $517,000 - $573,000
3
Beds
2
Baths
1,852
Sq Ft
$292/Sq Ft
Est. Value
About This Home
This home is located at 41 Drayton Ct, Blaine, WA 98230 and is currently estimated at $541,358, approximately $292 per square foot. 41 Drayton Ct is a home located in Whatcom County with nearby schools including Blaine Primary School, Blaine Elementary School, and Blaine Middle School.
Ownership History
Date
Name
Owned For
Owner Type
Purchase Details
Closed on
Mar 27, 2001
Sold by
Mcphail John M and Mcphail Amber
Bought by
Albright Sean D and Albright Corrina
Current Estimated Value
Home Financials for this Owner
Home Financials are based on the most recent Mortgage that was taken out on this home.
Original Mortgage
$94,500
Outstanding Balance
$34,940
Interest Rate
7.06%
Estimated Equity
$506,418
Create a Home Valuation Report for This Property
The Home Valuation Report is an in-depth analysis detailing your home's value as well as a comparison with similar homes in the area
Home Values in the Area
Average Home Value in this Area
Purchase History
| Date | Buyer | Sale Price | Title Company |
|---|---|---|---|
| Albright Sean D | $128,000 | First American Title Insuran |
Source: Public Records
Mortgage History
| Date | Status | Borrower | Loan Amount |
|---|---|---|---|
| Open | Albright Sean D | $94,500 |
Source: Public Records
Tax History Compared to Growth
Tax History
| Year | Tax Paid | Tax Assessment Tax Assessment Total Assessment is a certain percentage of the fair market value that is determined by local assessors to be the total taxable value of land and additions on the property. | Land | Improvement |
|---|---|---|---|---|
| 2024 | $3,359 | $498,873 | $133,200 | $365,673 |
| 2023 | $3,359 | $498,873 | $133,200 | $365,673 |
| 2022 | $3,073 | $449,435 | $120,000 | $329,435 |
| 2021 | $2,931 | $352,151 | $99,084 | $253,067 |
| 2020 | $2,789 | $306,218 | $86,160 | $220,058 |
| 2019 | $2,597 | $280,416 | $78,900 | $201,516 |
| 2018 | $2,414 | $254,827 | $71,700 | $183,127 |
| 2017 | $2,152 | $213,244 | $60,000 | $153,244 |
| 2016 | $2,213 | $213,244 | $60,000 | $153,244 |
| 2015 | $2,168 | $211,521 | $60,222 | $151,299 |
| 2014 | -- | $202,420 | $57,630 | $144,790 |
| 2013 | -- | $200,212 | $57,000 | $143,212 |
Source: Public Records
Map
Nearby Homes