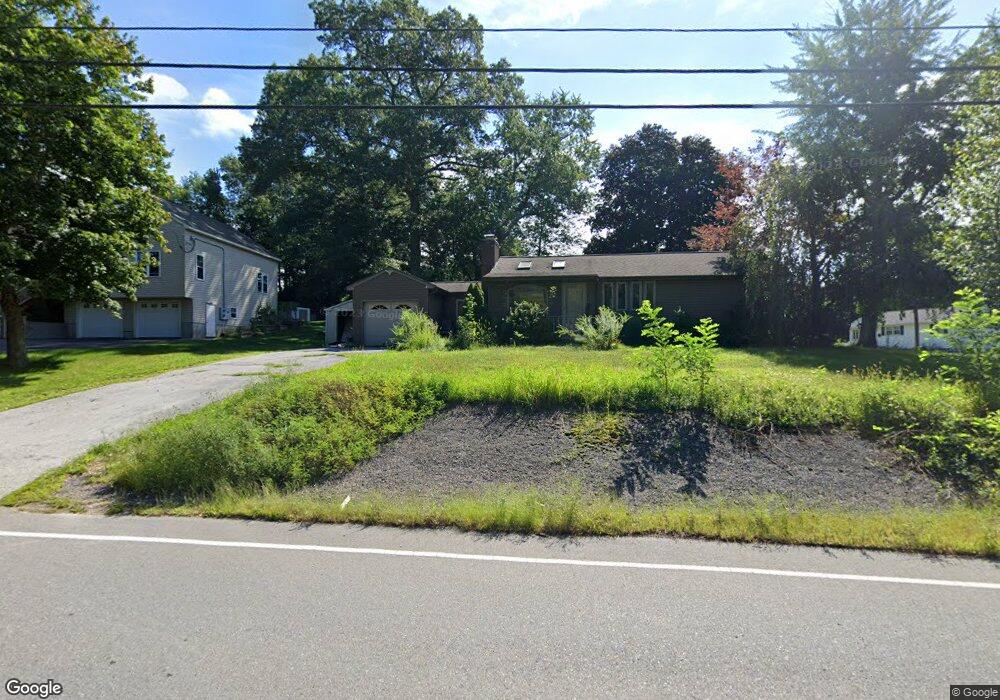
41 Dudley Rd Oxford, MA 01540
Estimated Value: $397,000 - $426,000
2
Beds
1
Bath
1,050
Sq Ft
$392/Sq Ft
Est. Value
About This Home
This home is located at 41 Dudley Rd, Oxford, MA 01540 and is currently estimated at $411,925, approximately $392 per square foot. 41 Dudley Rd is a home located in Worcester County with nearby schools including Alfred M Chaffee, Oxford High School, and Clara Barton Elementary School.
Ownership History
Date
Name
Owned For
Owner Type
Purchase Details
Closed on
Sep 13, 2007
Sold by
Okeefe Patricia A
Bought by
Donais Jordan
Current Estimated Value
Home Financials for this Owner
Home Financials are based on the most recent Mortgage that was taken out on this home.
Original Mortgage
$165,000
Outstanding Balance
$105,161
Interest Rate
6.7%
Mortgage Type
Purchase Money Mortgage
Estimated Equity
$306,764
Create a Home Valuation Report for This Property
The Home Valuation Report is an in-depth analysis detailing your home's value as well as a comparison with similar homes in the area
Home Values in the Area
Average Home Value in this Area
Purchase History
| Date | Buyer | Sale Price | Title Company |
|---|---|---|---|
| Donais Jordan | $230,000 | -- |
Source: Public Records
Mortgage History
| Date | Status | Borrower | Loan Amount |
|---|---|---|---|
| Open | Donais Jordan | $165,000 |
Source: Public Records
Tax History Compared to Growth
Tax History
| Year | Tax Paid | Tax Assessment Tax Assessment Total Assessment is a certain percentage of the fair market value that is determined by local assessors to be the total taxable value of land and additions on the property. | Land | Improvement |
|---|---|---|---|---|
| 2025 | $44 | $344,300 | $84,700 | $259,600 |
| 2024 | $4,098 | $304,000 | $80,800 | $223,200 |
| 2023 | $4,047 | $296,700 | $77,300 | $219,400 |
| 2022 | $4,056 | $251,000 | $76,100 | $174,900 |
| 2021 | $3,785 | $229,000 | $72,200 | $156,800 |
| 2020 | $3,665 | $220,000 | $72,200 | $147,800 |
| 2019 | $3,328 | $195,400 | $72,300 | $123,100 |
| 2018 | $3,150 | $182,400 | $72,300 | $110,100 |
| 2017 | $3,092 | $183,500 | $69,200 | $114,300 |
| 2016 | $3,107 | $183,500 | $69,200 | $114,300 |
| 2015 | $2,897 | $183,500 | $69,200 | $114,300 |
| 2014 | $2,808 | $187,200 | $67,400 | $119,800 |
Source: Public Records
Map
Nearby Homes