Estimated Value: $301,980 - $365,000
Studio
--
Bath
1,250
Sq Ft
$265/Sq Ft
Est. Value
About This Home
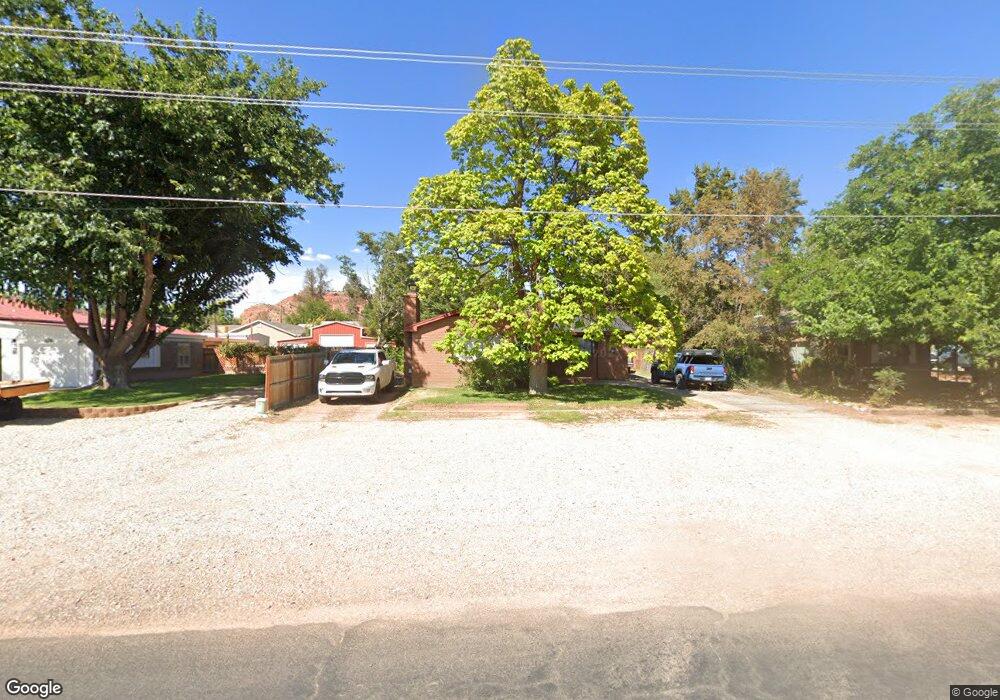
This home is located at 41 E 200 S, Kanab, UT 84741 and is currently estimated at $330,745, approximately $264 per square foot. 41 E 200 S is a home located in Kane County with nearby schools including Kanab Elementary School, Kanab Middle School, and Kanab High School.
Ownership History
Date
Name
Owned For
Owner Type
Purchase Details
Closed on
Jan 9, 2020
Sold by
Paula Zutes
Bought by
Turner Jeffrey C
Current Estimated Value
Purchase Details
Closed on
Oct 27, 2015
Sold by
Wj Ventures Llc
Bought by
Zutes Paula and Zutes Spring
Purchase Details
Closed on
May 4, 2015
Sold by
Paul M Paul M
Bought by
Deutsche Bank Nation Trust Company and Morgan Stanley Abs Capital I Inc Trust
Purchase Details
Closed on
Jun 1, 2010
Sold by
Deutsche Bank National Trust Company
Bought by
Woodall James H
Purchase Details
Closed on
Aug 8, 2006
Sold by
Fike Robert Lee and Fike Lee C
Bought by
Church Norris and Church Natalie
Home Financials for this Owner
Home Financials are based on the most recent Mortgage that was taken out on this home.
Original Mortgage
$126,640
Interest Rate
6.69%
Create a Home Valuation Report for This Property
The Home Valuation Report is an in-depth analysis detailing your home's value as well as a comparison with similar homes in the area
Home Values in the Area
Average Home Value in this Area
Purchase History
| Date | Buyer | Sale Price | Title Company |
|---|---|---|---|
| Turner Jeffrey C | -- | -- | |
| Zutes Paula | -- | -- | |
| Deutsche Bank Nation Trust Company | -- | -- | |
| Woodall James H | -- | -- | |
| Church Norris | -- | -- |
Source: Public Records
Mortgage History
| Date | Status | Borrower | Loan Amount |
|---|---|---|---|
| Previous Owner | Church Norris | $126,640 |
Source: Public Records
Tax History
| Year | Tax Paid | Tax Assessment Tax Assessment Total Assessment is a certain percentage of the fair market value that is determined by local assessors to be the total taxable value of land and additions on the property. | Land | Improvement |
|---|---|---|---|---|
| 2025 | $1,310 | $277,676 | $109,824 | $167,852 |
| 2024 | $1,325 | $153,937 | $49,921 | $104,016 |
| 2023 | $1,193 | $142,104 | $47,544 | $94,560 |
| 2022 | $1,039 | $122,535 | $36,572 | $85,963 |
| 2021 | $943 | $166,926 | $51,150 | $115,776 |
| 2020 | $1,657 | $156,548 | $46,500 | $110,048 |
| 2019 | $821 | $137,300 | $45,804 | $91,496 |
| 2018 | $782 | $129,666 | $38,170 | $91,496 |
| 2017 | $750 | $118,710 | $34,700 | $84,010 |
| 2016 | $675 | $103,824 | $34,700 | $69,124 |
| 2015 | $632 | $98,080 | $34,700 | $63,380 |
| 2014 | $632 | $96,753 | $37,150 | $59,603 |
| 2013 | -- | $53,215 | $0 | $0 |
Source: Public Records
Map
Nearby Homes
Your Personal Tour Guide
Ask me questions while you tour the home.