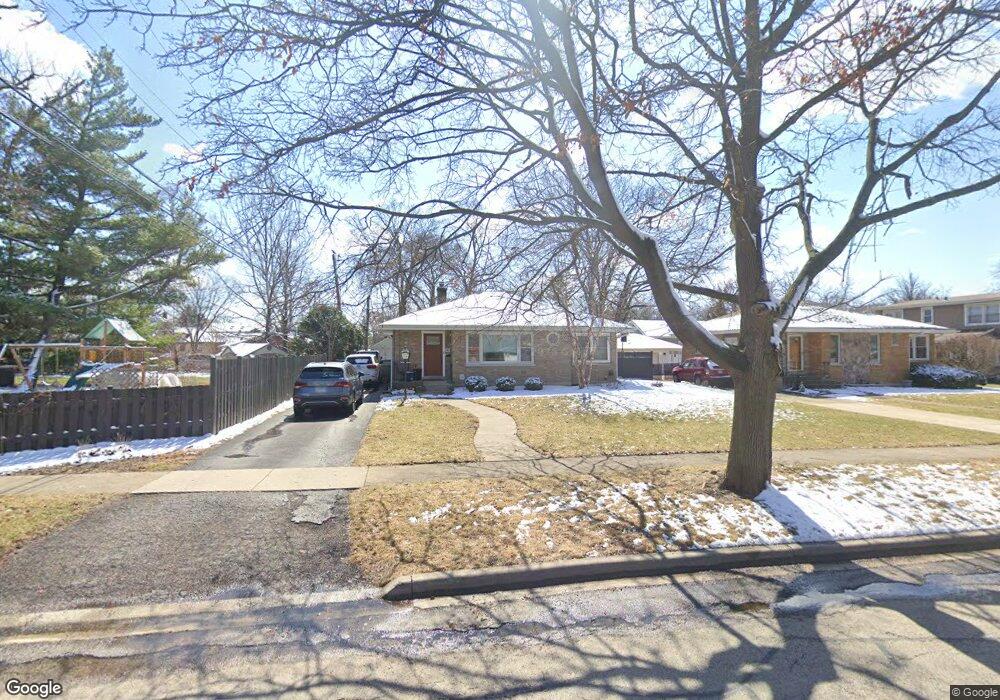
41 E Highland Ave Villa Park, IL 60181
Estimated Value: $367,000 - $393,000
3
Beds
1
Bath
1,253
Sq Ft
$301/Sq Ft
Est. Value
About This Home
This home is located at 41 E Highland Ave, Villa Park, IL 60181 and is currently estimated at $376,823, approximately $300 per square foot. 41 E Highland Ave is a home located in DuPage County with nearby schools including Ardmore Elementary School, Jackson Middle School, and Willowbrook High School.
Ownership History
Date
Name
Owned For
Owner Type
Purchase Details
Closed on
Jun 28, 2010
Sold by
Simek Vickie A and Backman Perkins Barbara K
Bought by
Warpool Michael H and Warpool Stacy S
Current Estimated Value
Home Financials for this Owner
Home Financials are based on the most recent Mortgage that was taken out on this home.
Original Mortgage
$209,400
Outstanding Balance
$140,120
Interest Rate
4.86%
Mortgage Type
VA
Estimated Equity
$236,703
Purchase Details
Closed on
Jul 18, 2003
Sold by
Burket Bonnie J
Bought by
Simek Vickie A and Backman Perkins Barbara K
Purchase Details
Closed on
Aug 1, 2001
Sold by
Burket Marion M
Bought by
Burket Marion M and Burket Bonnie J
Purchase Details
Closed on
Feb 2, 1990
Sold by
Burket James C
Bought by
Burket Marion M
Create a Home Valuation Report for This Property
The Home Valuation Report is an in-depth analysis detailing your home's value as well as a comparison with similar homes in the area
Home Values in the Area
Average Home Value in this Area
Purchase History
| Date | Buyer | Sale Price | Title Company |
|---|---|---|---|
| Warpool Michael H | $205,000 | Ticor Title Insurance Co | |
| Simek Vickie A | -- | Chicago Title Insurance Comp | |
| Burket Marion M | -- | Chicago Title Insurance Co | |
| Burket Marion M | -- | Chicago Title Insurance Co |
Source: Public Records
Mortgage History
| Date | Status | Borrower | Loan Amount |
|---|---|---|---|
| Open | Warpool Michael H | $209,400 |
Source: Public Records
Tax History Compared to Growth
Tax History
| Year | Tax Paid | Tax Assessment Tax Assessment Total Assessment is a certain percentage of the fair market value that is determined by local assessors to be the total taxable value of land and additions on the property. | Land | Improvement |
|---|---|---|---|---|
| 2024 | $6,670 | $96,255 | $26,321 | $69,934 |
| 2023 | $6,343 | $89,010 | $24,340 | $64,670 |
| 2022 | $6,186 | $85,560 | $23,400 | $62,160 |
| 2021 | $5,932 | $83,430 | $22,820 | $60,610 |
| 2020 | $5,789 | $81,600 | $22,320 | $59,280 |
| 2019 | $5,400 | $77,580 | $21,220 | $56,360 |
| 2018 | $5,358 | $72,710 | $19,890 | $52,820 |
| 2017 | $5,225 | $69,280 | $18,950 | $50,330 |
| 2016 | $5,071 | $65,260 | $17,850 | $47,410 |
| 2015 | $4,992 | $60,800 | $16,630 | $44,170 |
| 2014 | $5,742 | $69,280 | $31,270 | $38,010 |
| 2013 | $5,473 | $70,260 | $31,710 | $38,550 |
Source: Public Records
Map
Nearby Homes
- 194 Washington St
- 5 E Washington St
- 1 S 215 Stratford Ln
- 316 E Highland Ave
- 604 S Grant Ave
- 114 E Kenilworth Ave
- 530 E Highland Ave Unit A2
- 639 S Oakland Ave
- 727 S Oakland Ave
- 835 S Wisconsin Ave
- 1041 E Division St
- 1136 E Kenilworth Ave
- 235 N Ardmore Ave
- 409 W Madison St
- 247 N Ardmore Ave
- 928 S Michigan Ave
- 326 W Adams St
- 37 N Addison Rd
- 169 S Villa Ave
- 1150 E Jackson St Unit 1A
- 37 E Highland Ave
- 405 S Cornell Ave
- 411 S Cornell Ave
- 404 S Illinois Ave
- 400 S Illinois Ave
- 410 S Illinois Ave
- 417 S Cornell Ave
- 40 E Highland Ave
- 416 S Illinois Ave
- 36 E Highland Ave
- 104 E Highland Ave
- 419 S Cornell Ave
- 336 S Illinois Ave
- 32 E Highland Ave
- 420 S Illinois Ave
- 423 S Cornell Ave
- 330 S Illinois Ave
- 426 S Illinois Ave
- 333 S Cornell Ave
- 410 S Cornell Ave