41 E Maple St Wabash, IN 46992
Estimated Value: $148,000 - $187,000
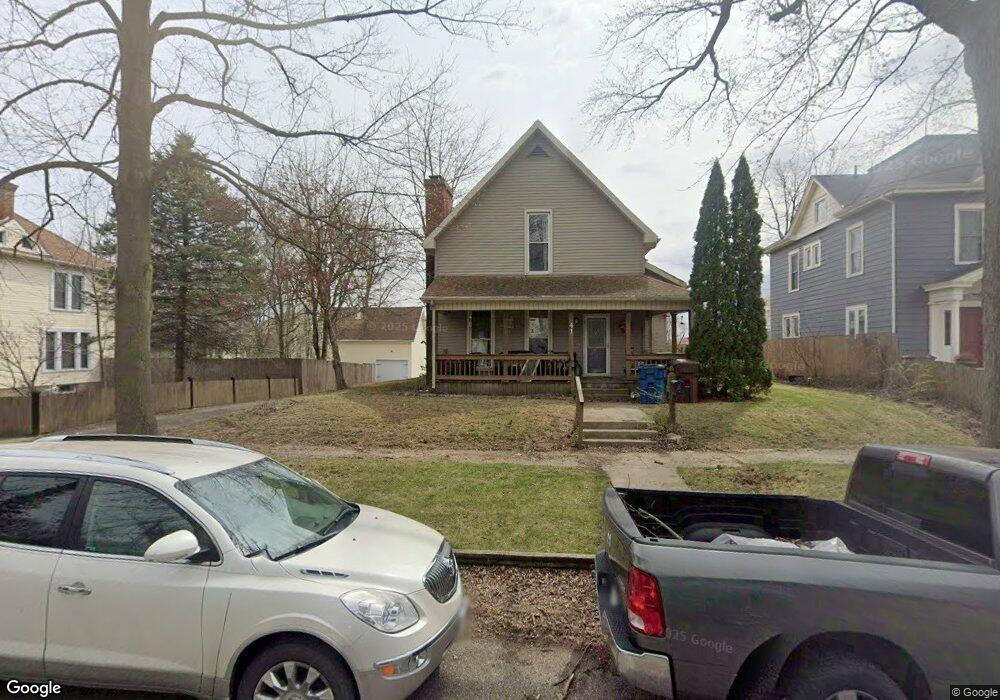
About This Home
This home is located at 41 E Maple St, Wabash, IN 46992 and is currently estimated at $166,905, approximately $87 per square foot. 41 E Maple St is a home located in Wabash County with nearby schools including O.J. Neighbours Elementary School, W C Mills Elementary School, and Wabash Middle School.
Ownership History
We collect this data history from publicly available records. To have your information removed, we recommend requesting removal directly through your county’s website.
Purchase Details
Home Financials for this Owner
Home Financials are based on the most recent Mortgage that was taken out on this home.Home Values in the Area
Average Home Value in this Area
Purchase History
We collect this data history from publicly available records. To have your information removed, we recommend requesting removal directly through your county’s website.
| Date | Buyer | Sale Price | Title Company |
|---|---|---|---|
| -- | None Available |
Mortgage History
We collect this data history from publicly available records. To have your information removed, we recommend requesting removal directly through your county’s website.
| Date | Status | Borrower | Loan Amount |
|---|---|---|---|
| Open | $70,300 |
Tax History
We collect this data history from publicly available records. To have your information removed, we recommend requesting removal directly through your county’s website.
| Year | Tax Paid | Tax Assessment Tax Assessment Total Assessment is a certain percentage of the fair market value that is determined by local assessors to be the total taxable value of land and additions on the property. | Land | Improvement |
|---|---|---|---|---|
| 2025 | $1,193 | $129,900 | $16,500 | $113,400 |
| 2024 | $1,100 | $110,000 | $16,500 | $93,500 |
| 2023 | $1,023 | $106,700 | $16,500 | $90,200 |
| 2022 | $925 | $92,600 | $13,200 | $79,400 |
| 2021 | $700 | $82,700 | $13,200 | $69,500 |
| 2020 | $668 | $81,400 | $13,200 | $68,200 |
| 2019 | $536 | $79,500 | $13,200 | $66,300 |
| 2018 | $538 | $79,500 | $13,200 | $66,300 |
| 2017 | $610 | $81,500 | $13,200 | $68,300 |
| 2016 | $401 | $82,600 | $13,200 | $69,400 |
| 2014 | $472 | $95,800 | $13,200 | $82,600 |
| 2013 | $1,879 | $93,900 | $13,200 | $80,700 |
Map
- 35 E Sinclair St
- 112 E Main St
- 425 N Huntington St
- 196 E Main St
- 218 E Main St
- 76 W Canal St
- 292 N Carroll St
- 347 E Main St
- 380 E Main St
- 570 N Wabash St
- 19 Conner St
- 305 Manchester Ave
- 495 Stitt St
- 783 N East St
- 691 W Hill St
- 1017 N Miami St
- 895 Stitt St
- 500 W Harrison Ave
- 528 Michigan St
- 1062 Alber St
- 31 E Maple St
- 65 E Maple St
- 44 E Maple St
- 26 E Maple St
- 58 E Maple St
- 73 E Maple St
- 66 E Maple St
- 26-28 E Maple St
- 189 N Wabash St
- 74 E Maple St
- 188 N Huntington St
- 178 N Huntington St
- 96 E Maple St
- 42 E Sinclair St
- 188 N Wabash St
- 58 E Sinclair St
- 5670 Indiana 15
- 162 N Wabash St
- 70 E Sinclair St
- 257 N Wabash St
Ask me questions while you tour the home.