Estimated Value: $84,865 - $123,000
2
Beds
1
Bath
1,011
Sq Ft
$108/Sq Ft
Est. Value
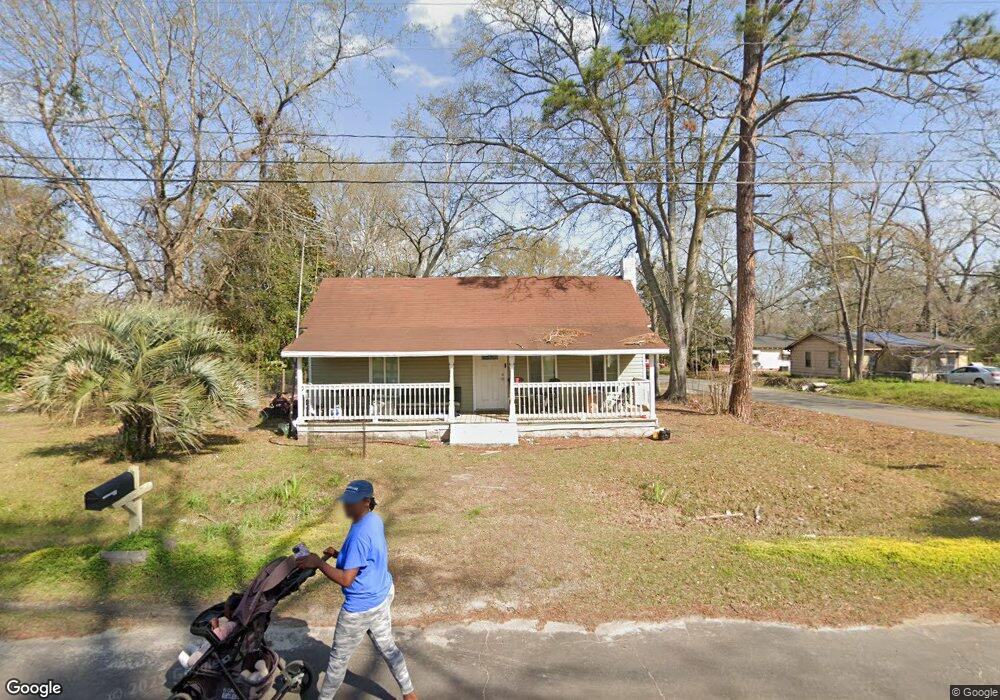
About This Home
This home is located at 41 E Sherman St, Lenox, GA 31637 and is currently estimated at $109,216, approximately $108 per square foot. 41 E Sherman St is a home located in Cook County with nearby schools including Cook Primary School, Cook Elementary School, and Cook County Middle School.
Ownership History
Date
Name
Owned For
Owner Type
Purchase Details
Closed on
Jul 12, 2023
Sold by
Malone Harrell Andrew
Bought by
Harrell Rental Properties Llc
Current Estimated Value
Purchase Details
Closed on
Jun 22, 2023
Sold by
Martinez Heleorodo R
Bought by
Harrell Andrew Malone
Purchase Details
Closed on
Oct 20, 2022
Sold by
Emily & Hannah Rentals Llc
Bought by
Martinez Heleorodo R
Purchase Details
Closed on
Sep 8, 2022
Sold by
Mallard Henry
Bought by
Emily & Hannah Rentals Llc
Purchase Details
Closed on
Jun 14, 2019
Sold by
Ballard Jarvis
Bought by
Mallard Henry
Purchase Details
Closed on
Mar 24, 2014
Sold by
Federal National Mortgage Association
Bought by
Ballard Jarvis
Purchase Details
Closed on
Oct 1, 2013
Sold by
Nationstar Mtg Llc
Bought by
Federal National Mtg Associati
Create a Home Valuation Report for This Property
The Home Valuation Report is an in-depth analysis detailing your home's value as well as a comparison with similar homes in the area
Purchase History
| Date | Buyer | Sale Price | Title Company |
|---|---|---|---|
| Harrell Rental Properties Llc | -- | -- | |
| Harrell Andrew Malone | $76,500 | -- | |
| Martinez Heleorodo R | $35,000 | -- | |
| Emily & Hannah Rentals Llc | $20,000 | -- | |
| Mallard Henry | $22,500 | -- | |
| Ballard Jarvis | $8,000 | -- | |
| Federal National Mtg Associati | $54,891 | -- | |
| Nationstar Mtg Llc | $54,891 | -- |
Source: Public Records
Tax History
| Year | Tax Paid | Tax Assessment Tax Assessment Total Assessment is a certain percentage of the fair market value that is determined by local assessors to be the total taxable value of land and additions on the property. | Land | Improvement |
|---|---|---|---|---|
| 2025 | $1,342 | $38,496 | $2,176 | $36,320 |
| 2024 | $799 | $29,680 | $1,720 | $27,960 |
| 2023 | $684 | $25,376 | $1,536 | $23,840 |
| 2022 | $312 | $11,585 | $1,536 | $10,049 |
| 2021 | $141 | $4,900 | $1,536 | $3,364 |
| 2020 | $141 | $4,900 | $1,536 | $3,364 |
| 2019 | $86 | $4,900 | $1,536 | $3,364 |
| 2018 | $142 | $4,900 | $1,536 | $3,364 |
| 2017 | $86 | $4,900 | $1,536 | $3,364 |
| 2016 | $86 | $4,900 | $1,536 | $3,364 |
| 2015 | $37 | $7,586 | $1,536 | $6,050 |
| 2014 | $220 | $7,586 | $1,536 | $6,050 |
| 2013 | -- | $7,586 | $1,536 | $6,050 |
Source: Public Records
Map
Nearby Homes
- 126 N Broad St
- 326 N Robinson St
- 320 E Central Ave
- 83 W Gray Ave
- 801 S Broad St
- 40 The Farm Ln
- 15170 U S 41
- 1629 Baker Sawmill Rd
- 0 Barneyville Rd Unit 149717
- 14268 Georgia 125
- 35 Lake Larry Dr
- 25 Briarwood Ln
- 0 E 0 Hwy 125 S
- 0 Red Bird Rd
- 0 Omega-Eldorado Rd
- 101 Red Bird Rd
- 8422 Massee Post Rd
- 69 Branch Ln
- 103 N College St
- 284 Barrett Rd
- 41 E Sherman Ave
- 65 E Sherman Ave
- 90 N Railroad St
- 207 N Rentz St
- 125 N Rentz St
- 81 Sherman Ave
- 124 N Rentz St
- 209 E Sherman Ave E
- 110 E Central Ave
- 159 N Rentz St
- 213 E Clement Ave E
- 166 N Rentz St
- 89 E Clement Ave
- 111 E Central Ave
- 109 N Robinson
- 1578 S Robinson St
- 142 E Sherman Ave
- 207 N Robinson St
- 20 E College Ave
- 144 E Clement Ave
Your Personal Tour Guide
Ask me questions while you tour the home.