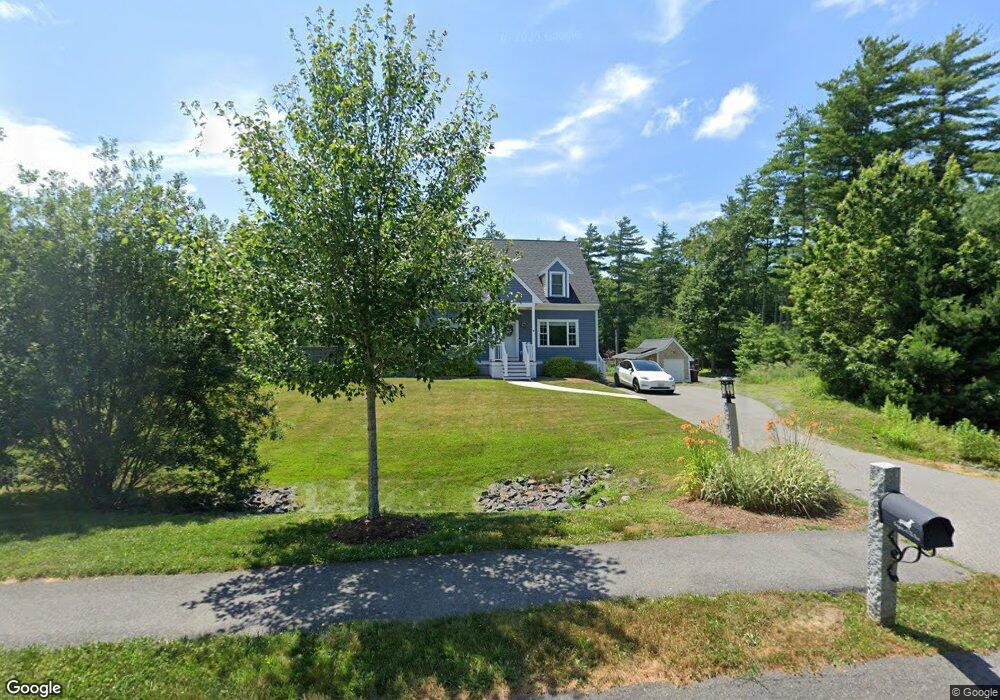
41 Elk Run Middleboro, MA 02346
Estimated Value: $542,000 - $710,000
3
Beds
3
Baths
1,761
Sq Ft
$371/Sq Ft
Est. Value
About This Home
This home is located at 41 Elk Run, Middleboro, MA 02346 and is currently estimated at $654,176, approximately $371 per square foot. 41 Elk Run is a home with nearby schools including Mary K. Goode Elementary School and Samuel Fuller School.
Ownership History
Date
Name
Owned For
Owner Type
Purchase Details
Closed on
Apr 27, 2020
Sold by
Nadolny Tracy C and Duguay Brett A
Bought by
Elk Run Development Llc
Current Estimated Value
Purchase Details
Closed on
Sep 3, 2013
Sold by
Elk Run Development Ll
Bought by
Nadolny-Duguay Tracy E and Duguay Brett A
Home Financials for this Owner
Home Financials are based on the most recent Mortgage that was taken out on this home.
Original Mortgage
$316,825
Interest Rate
4.4%
Mortgage Type
New Conventional
Create a Home Valuation Report for This Property
The Home Valuation Report is an in-depth analysis detailing your home's value as well as a comparison with similar homes in the area
Home Values in the Area
Average Home Value in this Area
Purchase History
| Date | Buyer | Sale Price | Title Company |
|---|---|---|---|
| Elk Run Development Llc | -- | None Available | |
| Nadolny-Duguay Tracy E | $333,500 | -- | |
| Nadolny-Duguay Tracy E | $333,500 | -- |
Source: Public Records
Mortgage History
| Date | Status | Borrower | Loan Amount |
|---|---|---|---|
| Previous Owner | Nadolny-Duguay Tracy E | $316,825 |
Source: Public Records
Tax History Compared to Growth
Tax History
| Year | Tax Paid | Tax Assessment Tax Assessment Total Assessment is a certain percentage of the fair market value that is determined by local assessors to be the total taxable value of land and additions on the property. | Land | Improvement |
|---|---|---|---|---|
| 2025 | $8,015 | $597,700 | $172,000 | $425,700 |
| 2024 | $7,857 | $580,300 | $172,200 | $408,100 |
| 2023 | $7,542 | $529,600 | $172,200 | $357,400 |
| 2022 | $6,926 | $450,300 | $163,800 | $286,500 |
| 2021 | $6,887 | $423,300 | $143,500 | $279,800 |
| 2020 | $6,631 | $417,600 | $143,500 | $274,100 |
| 2019 | $5,995 | $387,300 | $143,500 | $243,800 |
| 2018 | $5,758 | $369,100 | $131,000 | $238,100 |
| 2017 | $5,583 | $354,000 | $126,000 | $228,000 |
| 2016 | $5,155 | $323,800 | $118,800 | $205,000 |
| 2015 | $5,034 | $319,000 | $118,800 | $200,200 |
Source: Public Records
Map
Nearby Homes