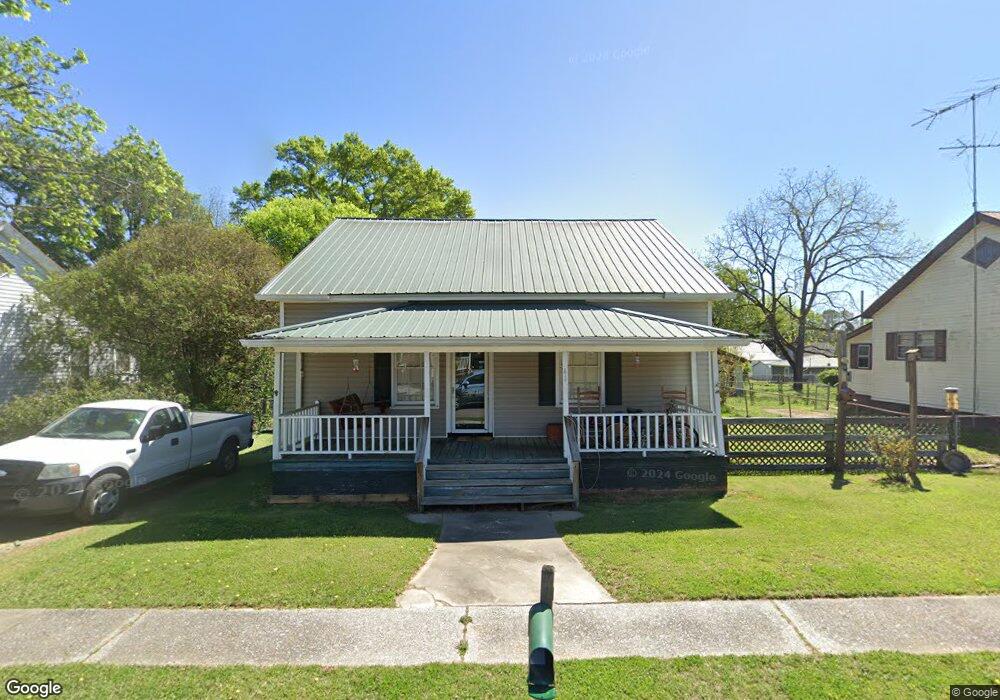
41 Elm St Aragon, GA 30104
Estimated Value: $109,000 - $192,000
2
Beds
2
Baths
1,164
Sq Ft
$125/Sq Ft
Est. Value
About This Home
This home is located at 41 Elm St, Aragon, GA 30104 and is currently estimated at $146,060, approximately $125 per square foot. 41 Elm St is a home located in Polk County with nearby schools including Rockmart Middle School.
Ownership History
Date
Name
Owned For
Owner Type
Purchase Details
Closed on
Jul 11, 2025
Sold by
Floyd Hal M
Bought by
Gilmer Jeffrey A
Current Estimated Value
Purchase Details
Closed on
Jan 27, 2025
Sold by
Floyd Hal M
Bought by
Floyd Hal M and Floyd Peggy B
Purchase Details
Closed on
Apr 14, 2006
Sold by
Seretary Of Housing
Bought by
Floyd Hal M
Purchase Details
Closed on
Sep 6, 2005
Sold by
Washington Mutual Bank
Bought by
Sec Dept Of Housing & Urban De
Purchase Details
Closed on
Apr 30, 2001
Sold by
Earley Christopher Thomas
Bought by
Coker Michael E
Purchase Details
Closed on
Apr 2, 1996
Sold by
Carden Patricia
Bought by
Earley Christopher Thomas
Purchase Details
Closed on
Aug 25, 1995
Sold by
Cochran Louise
Bought by
Carden Patricia
Purchase Details
Closed on
Feb 24, 1972
Sold by
Jones Roy
Bought by
Cochran Louise
Purchase Details
Closed on
Dec 16, 1960
Bought by
Jones Roy
Create a Home Valuation Report for This Property
The Home Valuation Report is an in-depth analysis detailing your home's value as well as a comparison with similar homes in the area
Home Values in the Area
Average Home Value in this Area
Purchase History
| Date | Buyer | Sale Price | Title Company |
|---|---|---|---|
| Gilmer Jeffrey A | $105,000 | -- | |
| Floyd Hal M | -- | -- | |
| Floyd Hal M | -- | -- | |
| Sec Dept Of Housing & Urban De | $55,199 | -- | |
| Washington Mutual Bank | $55,199 | -- | |
| Coker Michael E | $52,900 | -- | |
| Earley Christopher Thomas | $35,000 | -- | |
| Carden Patricia | $25,000 | -- | |
| Cochran Louise | -- | -- | |
| Jones Roy | -- | -- |
Source: Public Records
Tax History Compared to Growth
Tax History
| Year | Tax Paid | Tax Assessment Tax Assessment Total Assessment is a certain percentage of the fair market value that is determined by local assessors to be the total taxable value of land and additions on the property. | Land | Improvement |
|---|---|---|---|---|
| 2024 | $1,643 | $57,315 | $8,000 | $49,315 |
| 2023 | $867 | $26,549 | $840 | $25,709 |
| 2022 | $538 | $22,661 | $840 | $21,821 |
| 2021 | $545 | $22,661 | $840 | $21,821 |
| 2020 | $546 | $22,661 | $840 | $21,821 |
| 2019 | $550 | $20,474 | $1,831 | $18,643 |
| 2018 | $548 | $19,879 | $1,831 | $18,048 |
| 2017 | $541 | $19,879 | $1,831 | $18,048 |
| 2016 | $541 | $19,879 | $1,831 | $18,048 |
| 2015 | $514 | $18,814 | $1,831 | $16,982 |
| 2014 | $525 | $19,084 | $2,102 | $16,982 |
Source: Public Records
Map
Nearby Homes
- 58 Elm St
- 66 Elm St
- 18 Elm St
- 19 Walnut St
- 1 E 4th St
- 0 Rome Hwy 101 Unit 25352772
- 0 Rome Hwy 101 Unit 10445422
- 19 Williams St
- 100 Hixville Rd
- 11 Jenna Dr
- 54 Taylorsville Rd
- 11 Magnolia St
- 135 Oak Hollow Way
- 65 Long Station Rd
- 156 Dogwood Glen Dr
- 133 N Bellview Rd
- 180 Flint Hill Rd
- 330 Flint Hill Rd
- 71 Caseys Ridge Rd
- 163 Portland Cir