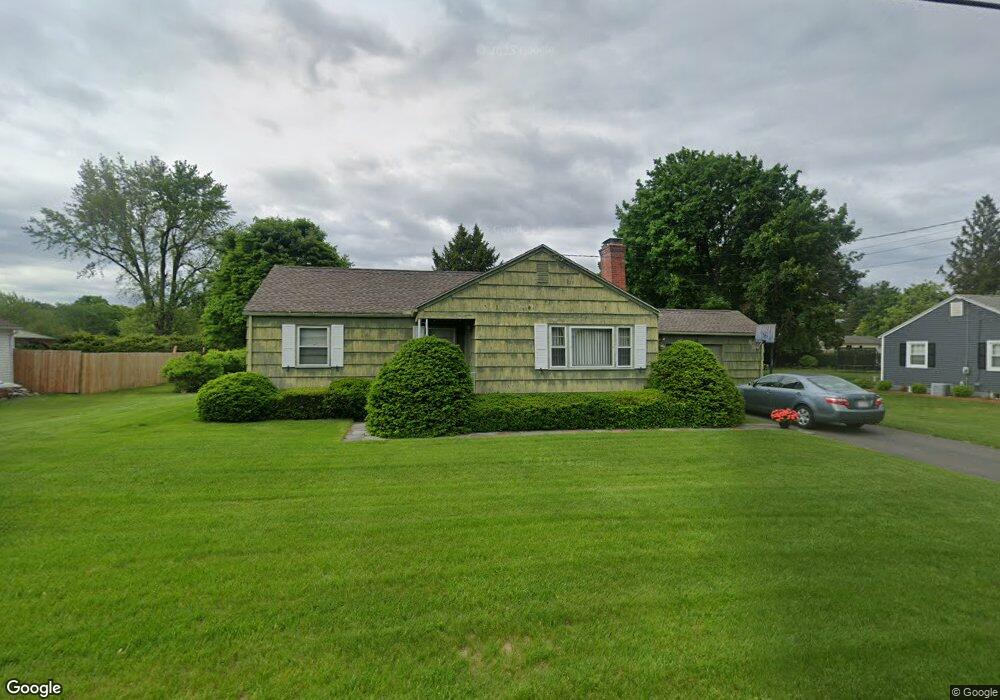
41 Ely St Westfield, MA 01085
Estimated Value: $317,000 - $346,000
3
Beds
1
Bath
1,048
Sq Ft
$316/Sq Ft
Est. Value
About This Home
This home is located at 41 Ely St, Westfield, MA 01085 and is currently estimated at $331,486, approximately $316 per square foot. 41 Ely St is a home located in Hampden County with nearby schools including Westfield High School and Saint Mary High School.
Ownership History
Date
Name
Owned For
Owner Type
Purchase Details
Closed on
May 25, 2010
Sold by
Beattie Harold T and Vecchio Lillian C
Bought by
Kabysh Viktor M and Kabysh Viktoriya I
Current Estimated Value
Home Financials for this Owner
Home Financials are based on the most recent Mortgage that was taken out on this home.
Original Mortgage
$152,100
Outstanding Balance
$102,841
Interest Rate
5.23%
Mortgage Type
Purchase Money Mortgage
Estimated Equity
$228,645
Create a Home Valuation Report for This Property
The Home Valuation Report is an in-depth analysis detailing your home's value as well as a comparison with similar homes in the area
Home Values in the Area
Average Home Value in this Area
Purchase History
| Date | Buyer | Sale Price | Title Company |
|---|---|---|---|
| Kabysh Viktor M | $169,000 | -- |
Source: Public Records
Mortgage History
| Date | Status | Borrower | Loan Amount |
|---|---|---|---|
| Open | Kabysh Viktor M | $152,100 |
Source: Public Records
Tax History
| Year | Tax Paid | Tax Assessment Tax Assessment Total Assessment is a certain percentage of the fair market value that is determined by local assessors to be the total taxable value of land and additions on the property. | Land | Improvement |
|---|---|---|---|---|
| 2025 | $4,155 | $273,700 | $115,500 | $158,200 |
| 2024 | $4,208 | $263,500 | $105,300 | $158,200 |
| 2023 | $4,050 | $238,500 | $100,200 | $138,300 |
| 2022 | $3,907 | $211,300 | $89,500 | $121,800 |
| 2021 | $4,162 | $199,900 | $84,100 | $115,800 |
| 2020 | $3,959 | $191,000 | $84,100 | $106,900 |
| 2019 | $3,594 | $182,700 | $80,300 | $102,400 |
| 2018 | $3,778 | $182,700 | $80,300 | $102,400 |
| 2017 | $3,482 | $179,300 | $81,400 | $97,900 |
| 2016 | $3,486 | $179,300 | $81,400 | $97,900 |
| 2015 | $3,324 | $179,300 | $81,400 | $97,900 |
| 2014 | $2,484 | $179,300 | $81,400 | $97,900 |
Source: Public Records
Map
Nearby Homes
- 419 Southwick Rd Unit P66
- 44 Tannery Rd
- 61 Plantation Cir
- 27 Rosewood Ln
- 91 Squawfield Rd
- 74 S Maple St
- 70 S Maple St
- 60 Mill St
- 112 Sunnyside Rd
- 30 Wynnfield Cir
- 16 Squawfield Rd
- 240 Hillside Rd
- 65 Old Farm Rd
- 5 Sawgrass Ln
- 929 Shaker Rd Unit 18
- 0 Fox Hill Dr
- 2 Cycle St
- 161 Wildflower Cir
- 13 Green Ave
- 44 Kensington Ave
Your Personal Tour Guide
Ask me questions while you tour the home.