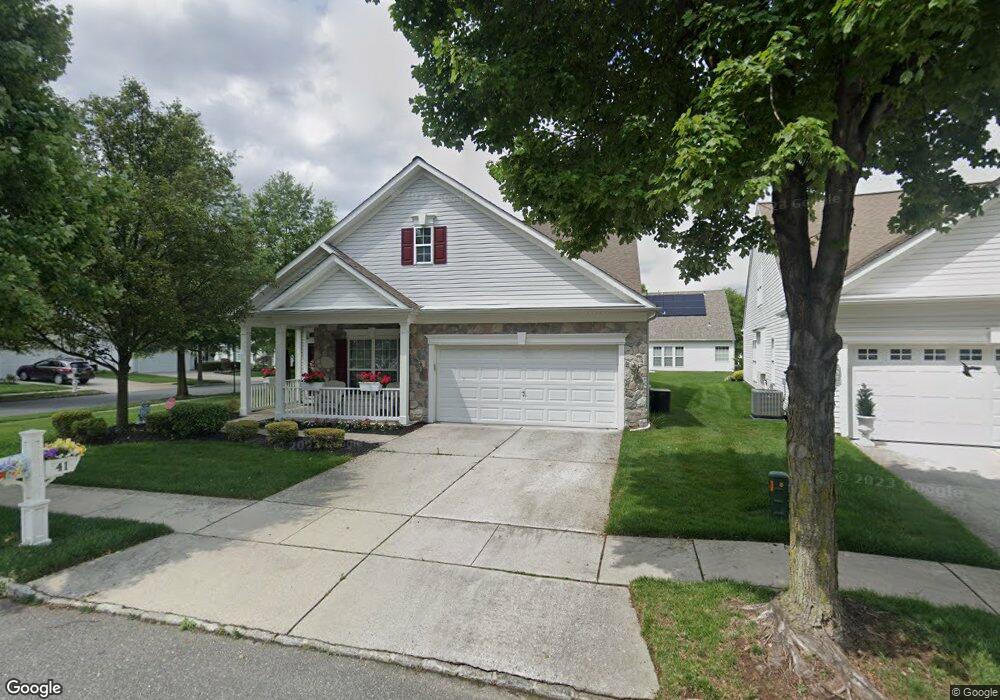
41 Emery Way Riverside, NJ 08075
Estimated Value: $474,000 - $503,000
--
Bed
--
Bath
2,431
Sq Ft
$201/Sq Ft
Est. Value
About This Home
This home is located at 41 Emery Way, Riverside, NJ 08075 and is currently estimated at $487,996, approximately $200 per square foot. 41 Emery Way is a home located in Burlington County with nearby schools including M. Joan Pearson Elementary School and Walnut Street Middle School.
Ownership History
Date
Name
Owned For
Owner Type
Purchase Details
Closed on
Feb 28, 2005
Sold by
Pulte Homes Of Nj Lp
Bought by
Mongulla Jack and Mongulla Tina
Current Estimated Value
Home Financials for this Owner
Home Financials are based on the most recent Mortgage that was taken out on this home.
Original Mortgage
$90,000
Outstanding Balance
$45,718
Interest Rate
5.64%
Mortgage Type
Fannie Mae Freddie Mac
Estimated Equity
$442,278
Create a Home Valuation Report for This Property
The Home Valuation Report is an in-depth analysis detailing your home's value as well as a comparison with similar homes in the area
Home Values in the Area
Average Home Value in this Area
Purchase History
| Date | Buyer | Sale Price | Title Company |
|---|---|---|---|
| Mongulla Jack | $295,165 | Surety Title Corp | |
| Mercado Jose L | $360,000 | Group 21 Title Agency | |
| -- | $295,200 | -- |
Source: Public Records
Mortgage History
| Date | Status | Borrower | Loan Amount |
|---|---|---|---|
| Open | -- | $90,000 | |
| Closed | -- | $90,000 |
Source: Public Records
Tax History Compared to Growth
Tax History
| Year | Tax Paid | Tax Assessment Tax Assessment Total Assessment is a certain percentage of the fair market value that is determined by local assessors to be the total taxable value of land and additions on the property. | Land | Improvement |
|---|---|---|---|---|
| 2025 | $9,780 | $278,000 | $52,800 | $225,200 |
| 2024 | $9,811 | $278,000 | $52,800 | $225,200 |
| 2023 | $9,811 | $278,000 | $52,800 | $225,200 |
| 2022 | $9,585 | $278,000 | $52,800 | $225,200 |
| 2021 | $9,555 | $278,000 | $52,800 | $225,200 |
| 2020 | $9,408 | $278,000 | $52,800 | $225,200 |
| 2019 | $9,146 | $278,000 | $52,800 | $225,200 |
| 2018 | $8,963 | $278,000 | $52,800 | $225,200 |
| 2017 | $8,793 | $278,000 | $52,800 | $225,200 |
| 2016 | $8,535 | $278,000 | $52,800 | $225,200 |
| 2015 | $8,393 | $278,000 | $52,800 | $225,200 |
| 2014 | $8,182 | $278,000 | $52,800 | $225,200 |
Source: Public Records
Map
Nearby Homes
- 15 Mccay Way
- 11 Mccay Way
- 77 Pennington Ct
- 0 Pennsylvania Ave
- 29 Pennington Ct
- 820 Laurel St
- 635 Laurel St
- 719 Hickory St
- 418 Delview Ln
- 719 Burlington Ave
- 222 Hazel Ave
- 323 Walnut St
- 601 Creek
- 815 Delaware Ave
- 315 Burlington Ave
- 229 Filmore St
- 209 Willow St
- 334 Kossuth St
- 304 Clay St
- 649 Bridgeboro St