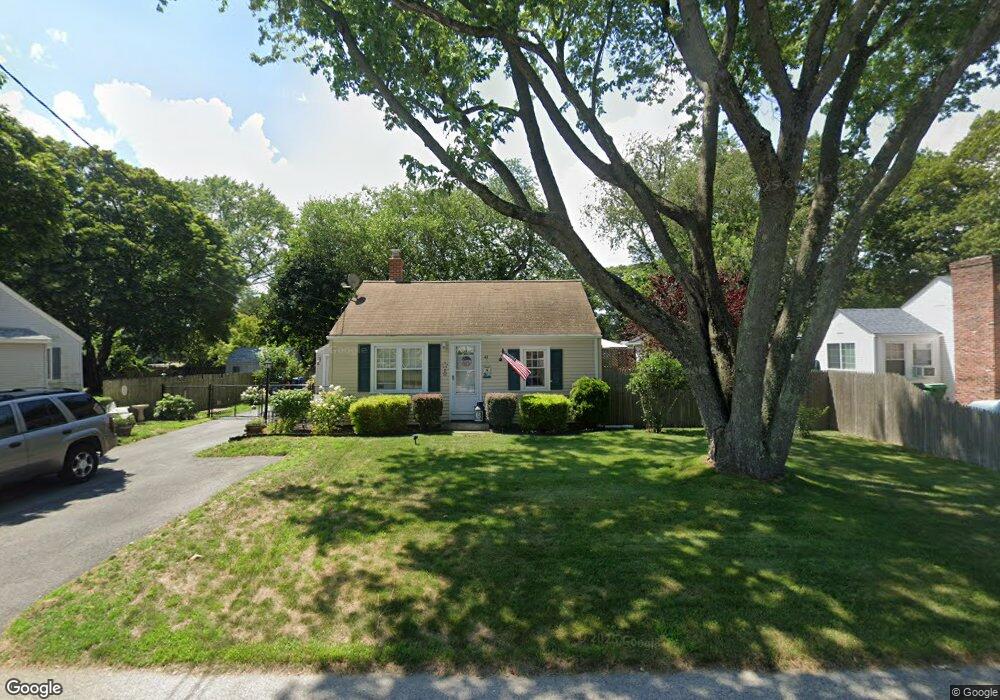
41 Euclid Ave Warwick, RI 02889
Hoxie NeighborhoodEstimated Value: $317,000 - $394,000
2
Beds
1
Bath
1,024
Sq Ft
$341/Sq Ft
Est. Value
About This Home
This home is located at 41 Euclid Ave, Warwick, RI 02889 and is currently estimated at $349,517, approximately $341 per square foot. 41 Euclid Ave is a home located in Kent County with nearby schools including Saint Kevin School and Bishop Hendricken High School.
Ownership History
Date
Name
Owned For
Owner Type
Purchase Details
Closed on
May 9, 2000
Sold by
Safford Jack K and Safford Esterina
Bought by
Cook Richard G and Cook Pauline J
Current Estimated Value
Purchase Details
Closed on
Aug 15, 1989
Sold by
Sousa Manuel E
Bought by
Safford Jack K
Create a Home Valuation Report for This Property
The Home Valuation Report is an in-depth analysis detailing your home's value as well as a comparison with similar homes in the area
Home Values in the Area
Average Home Value in this Area
Purchase History
| Date | Buyer | Sale Price | Title Company |
|---|---|---|---|
| Cook Richard G | $82,500 | -- | |
| Safford Jack K | $93,000 | -- | |
| Safford Jack K | $93,000 | -- |
Source: Public Records
Mortgage History
| Date | Status | Borrower | Loan Amount |
|---|---|---|---|
| Open | Safford Jack K | $114,994 | |
| Closed | Safford Jack K | $101,500 | |
| Closed | Safford Jack K | $15,000 |
Source: Public Records
Tax History Compared to Growth
Tax History
| Year | Tax Paid | Tax Assessment Tax Assessment Total Assessment is a certain percentage of the fair market value that is determined by local assessors to be the total taxable value of land and additions on the property. | Land | Improvement |
|---|---|---|---|---|
| 2025 | $3,752 | $295,400 | $105,300 | $190,100 |
| 2024 | $3,596 | $248,500 | $91,500 | $157,000 |
| 2023 | $3,526 | $248,500 | $91,500 | $157,000 |
| 2022 | $3,420 | $182,600 | $63,800 | $118,800 |
| 2021 | $3,420 | $182,600 | $63,800 | $118,800 |
| 2020 | $3,420 | $182,600 | $63,800 | $118,800 |
| 2019 | $3,420 | $182,600 | $63,800 | $118,800 |
| 2018 | $2,952 | $141,900 | $63,800 | $78,100 |
| 2017 | $2,872 | $141,900 | $63,800 | $78,100 |
| 2016 | $2,763 | $136,500 | $63,800 | $72,700 |
| 2015 | $2,637 | $127,100 | $56,400 | $70,700 |
| 2014 | $2,550 | $127,100 | $56,400 | $70,700 |
| 2013 | $2,515 | $127,100 | $56,400 | $70,700 |
Source: Public Records
Map
Nearby Homes
- 700 Sandy Ln Unit 6
- 700 Sandy Ln Unit 17
- 700 Sandy Ln Unit 18
- 700 Sandy Ln Unit 1
- 985 Cedar Swamp Rd
- 86 Glen Dr
- 136 Sefton Ave
- 139 Yucatan Dr
- 81 Yucatan Dr
- 121 Hamilton Ave
- 53 Uphill Ave
- 64 Ormsby Ave
- 176 Vernon St
- 28 Liverpool St
- 70 Turner St Unit C-6
- 183 Shand Ave
- 176 Canfield Ave
- 206 Reynolds Ave
- 191 Canfield Ave
- 38 Parade Rd