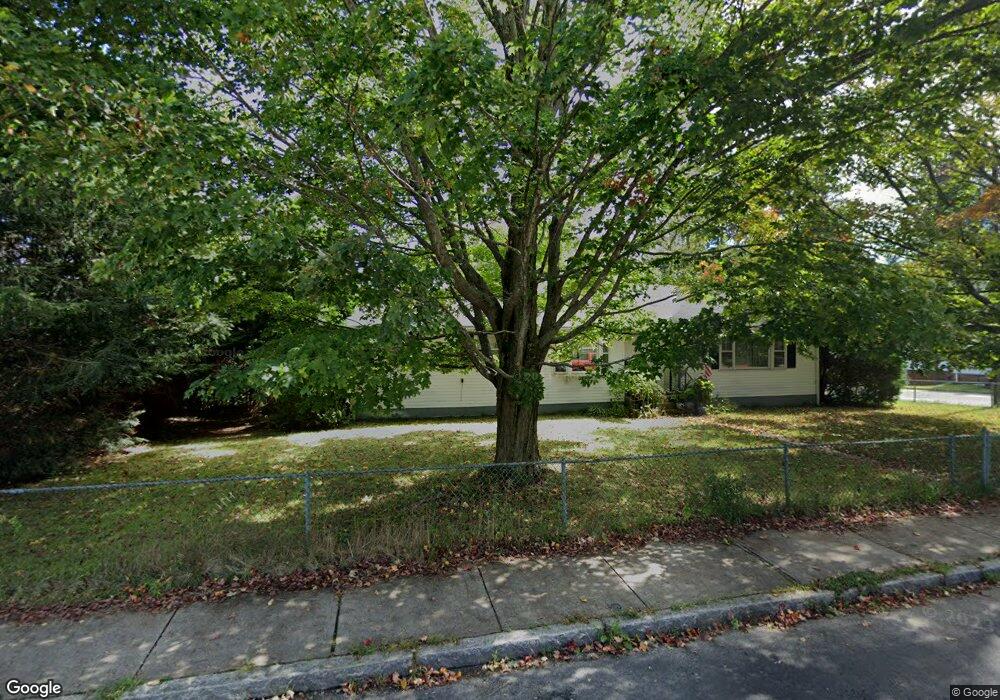
41 Everett St Southbridge, MA 01550
Estimated Value: $368,000 - $395,000
4
Beds
2
Baths
2,149
Sq Ft
$176/Sq Ft
Est. Value
About This Home
This home is located at 41 Everett St, Southbridge, MA 01550 and is currently estimated at $378,686, approximately $176 per square foot. 41 Everett St is a home located in Worcester County with nearby schools including Trinity Catholic Academy and ViewPoint Christian Academy.
Ownership History
Date
Name
Owned For
Owner Type
Purchase Details
Closed on
Oct 26, 2012
Sold by
Ymca
Bought by
Delacruz Juan and Cempe Jessica I
Current Estimated Value
Purchase Details
Closed on
Apr 23, 2009
Sold by
Chase Home Finance Llc and Us Bk
Bought by
Dellacruz Juan and Cempe Jessica I
Home Financials for this Owner
Home Financials are based on the most recent Mortgage that was taken out on this home.
Original Mortgage
$148,540
Interest Rate
4.93%
Mortgage Type
Purchase Money Mortgage
Create a Home Valuation Report for This Property
The Home Valuation Report is an in-depth analysis detailing your home's value as well as a comparison with similar homes in the area
Home Values in the Area
Average Home Value in this Area
Purchase History
| Date | Buyer | Sale Price | Title Company |
|---|---|---|---|
| Delacruz Juan | $159,000 | -- | |
| Dellacruz Juan | $153,135 | -- | |
| Dellacruz Juan | $153,135 | -- |
Source: Public Records
Mortgage History
| Date | Status | Borrower | Loan Amount |
|---|---|---|---|
| Previous Owner | Dellacruz Juan | $148,540 |
Source: Public Records
Tax History
| Year | Tax Paid | Tax Assessment Tax Assessment Total Assessment is a certain percentage of the fair market value that is determined by local assessors to be the total taxable value of land and additions on the property. | Land | Improvement |
|---|---|---|---|---|
| 2025 | $4,407 | $300,600 | $36,700 | $263,900 |
| 2024 | $4,077 | $267,200 | $30,600 | $236,600 |
| 2023 | $3,841 | $242,500 | $30,600 | $211,900 |
| 2022 | $3,661 | $204,500 | $26,100 | $178,400 |
| 2021 | $3,975 | $204,500 | $26,100 | $178,400 |
| 2020 | $3,871 | $198,700 | $26,100 | $172,600 |
| 2018 | $3,279 | $158,000 | $23,200 | $134,800 |
| 2017 | $3,281 | $159,500 | $23,200 | $136,300 |
| 2016 | $3,114 | $154,100 | $23,200 | $130,900 |
| 2015 | $2,944 | $144,600 | $23,200 | $121,400 |
| 2014 | $2,840 | $144,600 | $23,200 | $121,400 |
Source: Public Records
Map
Nearby Homes
- 41 Everett St
- 41A Everett St
- 141 Main St
- 19 Everett St Unit B
- 19 Everett St Unit 1
- 19 Everett St
- 51 Everett St
- 47 Everett St Unit 2F
- 47 Everett St
- 205 Main St
- 63 Everett St
- 32 Everett St
- 13 Oak Ridge Ave
- 69 Everett St
- 69 Everett St Unit 3
- 44 Everett St
- 56 Everett St
- 73 Everett St Unit 73
- 176 Main St Unit 2
- 176 Main St Unit 400
Your Personal Tour Guide
Ask me questions while you tour the home.