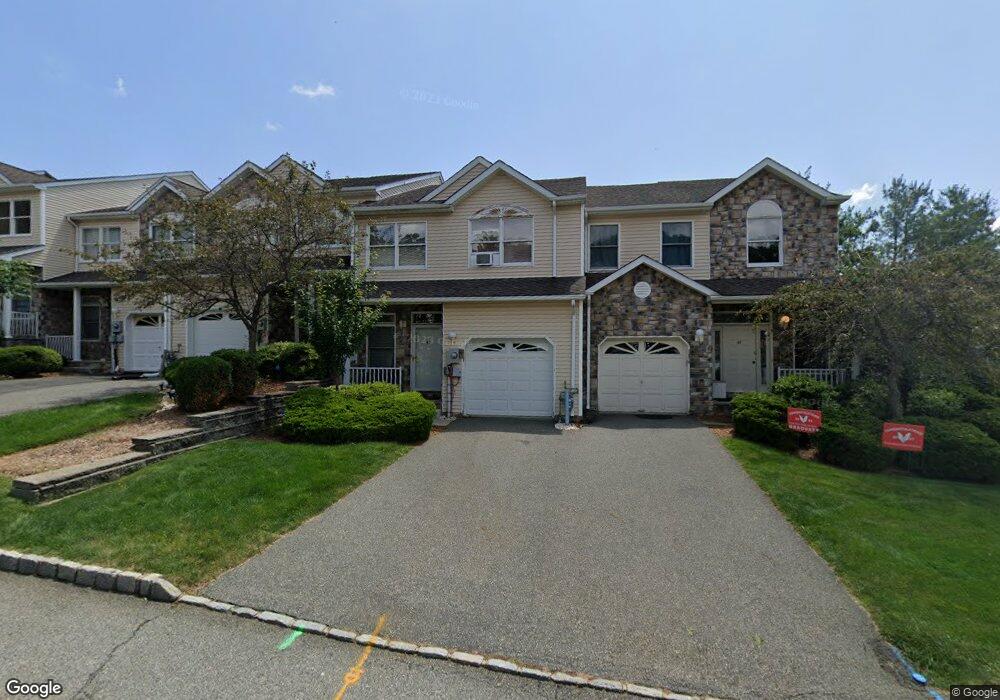
41 F Houston Taylor Ct Morris Plains, NJ 07950
Estimated Value: $634,790 - $705,000
--
Bed
--
Bath
1,676
Sq Ft
$399/Sq Ft
Est. Value
About This Home
This home is located at 41 F Houston Taylor Ct, Morris Plains, NJ 07950 and is currently estimated at $668,448, approximately $398 per square foot. 41 F Houston Taylor Ct is a home located in Morris County with nearby schools including Mount Tabor School, Brooklawn Middle School, and Parsippany Hills High School.
Ownership History
Date
Name
Owned For
Owner Type
Purchase Details
Closed on
Aug 14, 2015
Sold by
Amenta Stasia
Bought by
Hansen Stasia E
Current Estimated Value
Home Financials for this Owner
Home Financials are based on the most recent Mortgage that was taken out on this home.
Original Mortgage
$328,000
Outstanding Balance
$258,495
Interest Rate
4.09%
Mortgage Type
New Conventional
Estimated Equity
$409,953
Purchase Details
Closed on
Mar 19, 2014
Sold by
Amenta Diego M and Amenta Stasia
Bought by
Amenta Stasia
Purchase Details
Closed on
Dec 17, 2004
Sold by
Kormillitsina Alla
Bought by
Amenta Diego and Amenta Stasia
Purchase Details
Closed on
Dec 26, 2002
Sold by
Commons Glenmont
Bought by
Kormilitsina Alla
Home Financials for this Owner
Home Financials are based on the most recent Mortgage that was taken out on this home.
Original Mortgage
$260,000
Interest Rate
6.19%
Create a Home Valuation Report for This Property
The Home Valuation Report is an in-depth analysis detailing your home's value as well as a comparison with similar homes in the area
Home Values in the Area
Average Home Value in this Area
Purchase History
| Date | Buyer | Sale Price | Title Company |
|---|---|---|---|
| Hansen Stasia E | -- | Max Title Agency Llc | |
| Amenta Stasia | -- | None Available | |
| Amenta Diego | $440,001 | -- | |
| Kormilitsina Alla | $325,000 | -- |
Source: Public Records
Mortgage History
| Date | Status | Borrower | Loan Amount |
|---|---|---|---|
| Open | Hansen Stasia E | $328,000 | |
| Previous Owner | Kormilitsina Alla | $260,000 |
Source: Public Records
Tax History Compared to Growth
Tax History
| Year | Tax Paid | Tax Assessment Tax Assessment Total Assessment is a certain percentage of the fair market value that is determined by local assessors to be the total taxable value of land and additions on the property. | Land | Improvement |
|---|---|---|---|---|
| 2025 | $11,492 | $330,800 | $115,500 | $215,300 |
| 2024 | $11,274 | $330,800 | $115,500 | $215,300 |
| 2023 | $11,274 | $330,800 | $115,500 | $215,300 |
| 2022 | $10,490 | $330,800 | $115,500 | $215,300 |
| 2021 | $10,490 | $330,800 | $115,500 | $215,300 |
| 2020 | $10,202 | $330,800 | $115,500 | $215,300 |
| 2019 | $9,927 | $330,800 | $115,500 | $215,300 |
| 2018 | $9,646 | $330,800 | $115,500 | $215,300 |
| 2017 | $9,428 | $330,800 | $115,500 | $215,300 |
| 2016 | $9,266 | $330,800 | $115,500 | $215,300 |
| 2015 | $9,031 | $330,800 | $115,500 | $215,300 |
| 2014 | $8,899 | $330,800 | $115,500 | $215,300 |
Source: Public Records
Map
Nearby Homes
- 52 Wiley Ct
- 637 Old Dover Rd
- 104 S Powder Mill Rd
- 76 Henning Terrace
- 64 Henning Terrace
- 840 Mountain Way
- 82 Union Hill Rd
- 24 Henning Terrace
- 19 Way Unit 2
- 24 General Winds Way Unit 1
- 22 General Winds Way Unit 6
- 10 Wadsworth Dr Unit 2
- 6 Wadsworth Dr Unit 5
- 83 Patriots Rd
- 23 Wadsworth Dr Unit 6
- 21 Puddingstone Rd
- 11 Wadsworth Dr Unit 6
- 7 Wadsworth Dr Unit 6
- 3 Wadsworth Dr Unit 6
- Isleton Plan at Mason Ridge
- 35 F Houston Taylor Ct
- 35 F Huston Taylor Ct
- 29 F Houston Taylor Ct
- 23 F Huston Taylor Ct
- 47 F Houston Taylor Ct
- 23 F Houston Taylor Ct
- 17 F Houston Taylor Ct
- 11 F Huston Taylor Ct
- 11 F Houston Taylor Ct
- 42 F Houston Taylor Ct
- 30 F Houston Taylor Ct
- 60 Arlene Ct
- 38 Arlene Ct
- 96 Arlene Ct
- 32 Arlene Ct
- 74 Arlene Ct
- 76 Arlene Ct
- 72 Arlene Ct
- 78 Arlene Ct
- 92 Arlene Ct