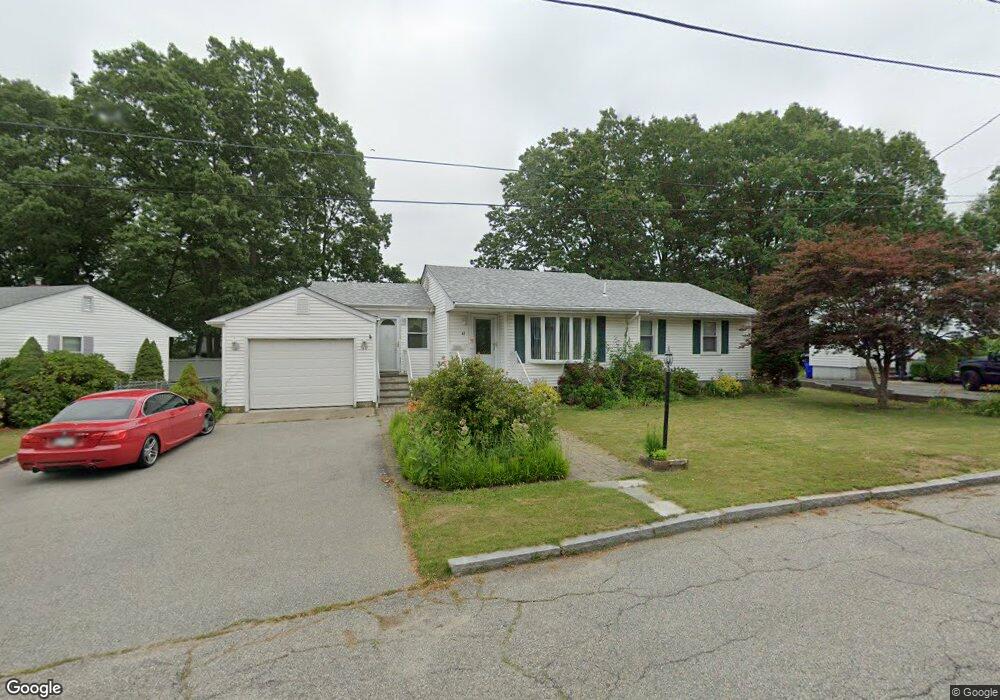
41 Fenmore St Fall River, MA 02723
Bank Street NeighborhoodEstimated Value: $441,184 - $519,000
3
Beds
1
Bath
1,832
Sq Ft
$262/Sq Ft
Est. Value
About This Home
This home is located at 41 Fenmore St, Fall River, MA 02723 and is currently estimated at $479,296, approximately $261 per square foot. 41 Fenmore St is a home located in Bristol County with nearby schools including Mary Fonseca Elementary School, Talbot Innovation School, and B M C Durfee High School.
Ownership History
Date
Name
Owned For
Owner Type
Purchase Details
Closed on
May 14, 2024
Sold by
Cirreira and Lincoln Teresa
Bought by
Pereira Josep and Lincoln Teresa
Current Estimated Value
Purchase Details
Closed on
Dec 1, 1997
Sold by
Mardula Judith
Bought by
Pereira Jose L and Pereira Alzira
Home Financials for this Owner
Home Financials are based on the most recent Mortgage that was taken out on this home.
Original Mortgage
$65,000
Interest Rate
7.26%
Mortgage Type
Purchase Money Mortgage
Create a Home Valuation Report for This Property
The Home Valuation Report is an in-depth analysis detailing your home's value as well as a comparison with similar homes in the area
Home Values in the Area
Average Home Value in this Area
Purchase History
| Date | Buyer | Sale Price | Title Company |
|---|---|---|---|
| Pereira Josep | -- | None Available | |
| Pereira Joseph | -- | None Available | |
| Pereira Josep | -- | None Available | |
| Pereira Jose L | $130,000 | -- | |
| Pereira Jose L | $130,000 | -- |
Source: Public Records
Mortgage History
| Date | Status | Borrower | Loan Amount |
|---|---|---|---|
| Previous Owner | Pereira Jose L | $65,000 |
Source: Public Records
Tax History
| Year | Tax Paid | Tax Assessment Tax Assessment Total Assessment is a certain percentage of the fair market value that is determined by local assessors to be the total taxable value of land and additions on the property. | Land | Improvement |
|---|---|---|---|---|
| 2025 | $4,316 | $376,900 | $139,600 | $237,300 |
| 2024 | $4,033 | $351,000 | $134,300 | $216,700 |
| 2023 | $3,936 | $320,800 | $120,500 | $200,300 |
| 2022 | $3,463 | $274,400 | $111,600 | $162,800 |
| 2021 | $3,502 | $253,200 | $105,400 | $147,800 |
| 2020 | $3,374 | $233,500 | $101,400 | $132,100 |
| 2019 | $3,275 | $224,600 | $101,400 | $123,200 |
| 2018 | $3,154 | $215,700 | $101,400 | $114,300 |
| 2017 | $2,992 | $213,700 | $101,400 | $112,300 |
| 2016 | $2,836 | $208,100 | $101,400 | $106,700 |
| 2015 | $2,637 | $201,600 | $94,900 | $106,700 |
| 2014 | $2,536 | $201,600 | $94,900 | $106,700 |
Source: Public Records
Map
Nearby Homes
Your Personal Tour Guide
Ask me questions while you tour the home.