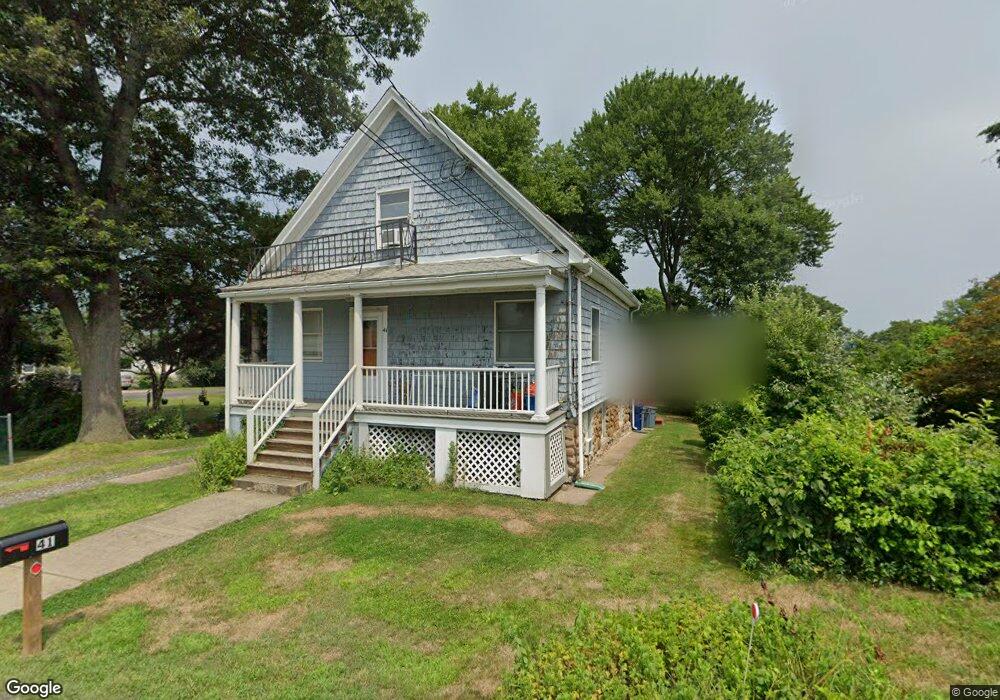
41 Fenwick St West Haven, CT 06516
Allingtown NeighborhoodEstimated Value: $285,000 - $523,447
4
Beds
3
Baths
1,479
Sq Ft
$288/Sq Ft
Est. Value
About This Home
This home is located at 41 Fenwick St, West Haven, CT 06516 and is currently estimated at $426,362, approximately $288 per square foot. 41 Fenwick St is a home located in New Haven County with nearby schools including Carrigan 5/6 Intermediate School, Harry M. Bailey Middle School, and West Haven High School.
Ownership History
Date
Name
Owned For
Owner Type
Purchase Details
Closed on
Feb 23, 1999
Sold by
Marsh James J
Bought by
Marsh Ralph P
Current Estimated Value
Home Financials for this Owner
Home Financials are based on the most recent Mortgage that was taken out on this home.
Original Mortgage
$70,000
Outstanding Balance
$15,299
Interest Rate
6.88%
Mortgage Type
Purchase Money Mortgage
Estimated Equity
$411,063
Purchase Details
Closed on
Mar 16, 1998
Sold by
Martin Tr Ralph P
Bought by
Marsh Tr Ralph P and Marsh James J
Create a Home Valuation Report for This Property
The Home Valuation Report is an in-depth analysis detailing your home's value as well as a comparison with similar homes in the area
Home Values in the Area
Average Home Value in this Area
Purchase History
| Date | Buyer | Sale Price | Title Company |
|---|---|---|---|
| Marsh Ralph P | $65,000 | -- | |
| Marsh Ralph P | $65,000 | -- | |
| Marsh Tr Ralph P | $160,000 | -- | |
| Marsh Tr Ralph P | $160,000 | -- |
Source: Public Records
Mortgage History
| Date | Status | Borrower | Loan Amount |
|---|---|---|---|
| Open | Marsh Tr Ralph P | $70,000 | |
| Closed | Marsh Tr Ralph P | $70,000 |
Source: Public Records
Tax History
| Year | Tax Paid | Tax Assessment Tax Assessment Total Assessment is a certain percentage of the fair market value that is determined by local assessors to be the total taxable value of land and additions on the property. | Land | Improvement |
|---|---|---|---|---|
| 2025 | $7,697 | $226,310 | $67,200 | $159,110 |
| 2024 | $6,537 | $136,500 | $46,550 | $89,950 |
| 2023 | $6,336 | $136,500 | $46,550 | $89,950 |
| 2022 | $6,226 | $136,500 | $46,550 | $89,950 |
| 2021 | $6,227 | $136,500 | $46,550 | $89,950 |
| 2020 | $5,335 | $103,600 | $38,080 | $65,520 |
| 2019 | $5,253 | $103,600 | $38,080 | $65,520 |
| 2018 | $5,110 | $103,600 | $38,080 | $65,520 |
| 2017 | $4,950 | $103,600 | $38,080 | $65,520 |
| 2016 | $4,800 | $103,600 | $38,080 | $65,520 |
| 2015 | $4,737 | $116,410 | $40,600 | $75,810 |
| 2014 | $4,642 | $116,410 | $40,600 | $75,810 |
Source: Public Records
Map
Nearby Homes
- 23 Yates St
- 110 Fenwick St
- 148 Burwell Rd
- 127 Rangely St
- 50 Maltby Ave
- 34 Maltby Ave
- 50 Morris Ave
- 47 Dix St
- 38 Chauncey St
- 45 Swampscott St
- 1 Rodney St
- 690 Forest Rd Unit 702
- 690 Forest Rd Unit 761
- 690 Forest Rd Unit 501
- 690 Forest Rd Unit 651
- 194 Homeside Ave
- 57 Dalton St
- 7 Ipswich St
- 309 Terrace Ave Unit 44
- 15 Crest St Unit 27
Your Personal Tour Guide
Ask me questions while you tour the home.