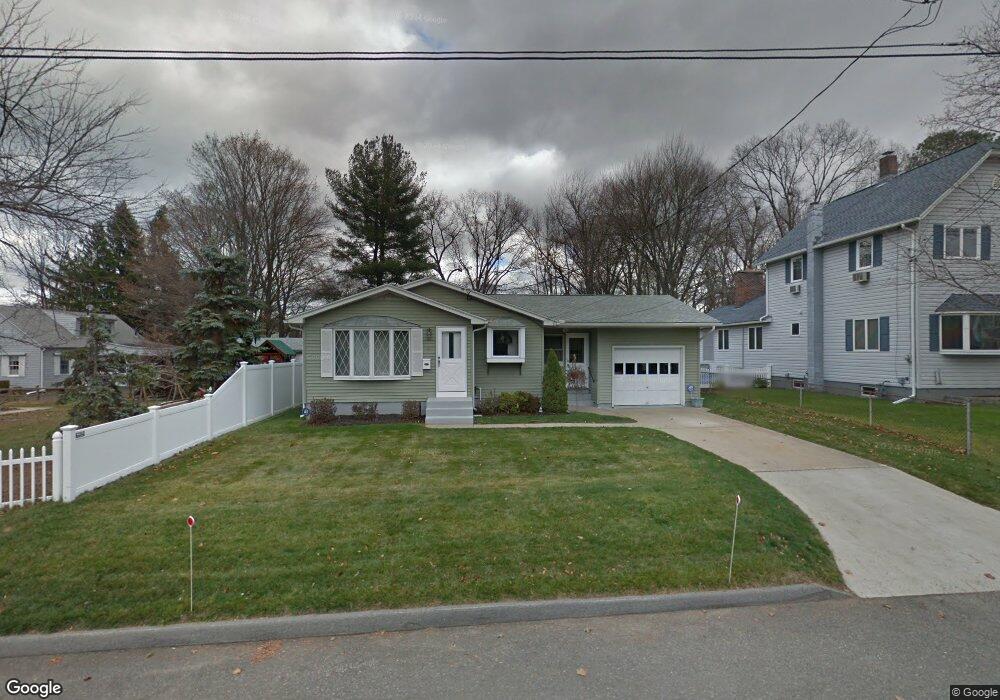
41 Fillmore St Chicopee, MA 01020
Fairview NeighborhoodEstimated Value: $278,000 - $339,000
3
Beds
1
Bath
1,034
Sq Ft
$305/Sq Ft
Est. Value
About This Home
This home is located at 41 Fillmore St, Chicopee, MA 01020 and is currently estimated at $315,802, approximately $305 per square foot. 41 Fillmore St is a home located in Hampden County with nearby schools including Bowie Elementary School, Fairview Middle School, and Chicopee Comprehensive High School.
Ownership History
Date
Name
Owned For
Owner Type
Purchase Details
Closed on
Sep 29, 2005
Sold by
Hedge Charles W and Hedge Margaret V
Bought by
Hedge Timothy J and Hedge Lori-Ann
Current Estimated Value
Home Financials for this Owner
Home Financials are based on the most recent Mortgage that was taken out on this home.
Original Mortgage
$144,000
Outstanding Balance
$76,518
Interest Rate
5.84%
Mortgage Type
Purchase Money Mortgage
Estimated Equity
$239,284
Create a Home Valuation Report for This Property
The Home Valuation Report is an in-depth analysis detailing your home's value as well as a comparison with similar homes in the area
Home Values in the Area
Average Home Value in this Area
Purchase History
| Date | Buyer | Sale Price | Title Company |
|---|---|---|---|
| Hedge Timothy J | $180,000 | -- |
Source: Public Records
Mortgage History
| Date | Status | Borrower | Loan Amount |
|---|---|---|---|
| Open | Hedge Timothy J | $144,000 |
Source: Public Records
Tax History
| Year | Tax Paid | Tax Assessment Tax Assessment Total Assessment is a certain percentage of the fair market value that is determined by local assessors to be the total taxable value of land and additions on the property. | Land | Improvement |
|---|---|---|---|---|
| 2025 | $4,225 | $278,700 | $108,100 | $170,600 |
| 2024 | $4,013 | $271,900 | $105,900 | $166,000 |
| 2023 | $3,807 | $251,300 | $96,300 | $155,000 |
| 2022 | $3,665 | $215,700 | $83,700 | $132,000 |
| 2021 | $3,494 | $198,400 | $76,100 | $122,300 |
| 2020 | $3,373 | $193,200 | $78,200 | $115,000 |
| 2019 | $3,341 | $186,000 | $78,200 | $107,800 |
| 2018 | $3,268 | $178,500 | $74,400 | $104,100 |
| 2017 | $2,906 | $167,900 | $68,800 | $99,100 |
| 2016 | $2,851 | $168,600 | $68,800 | $99,800 |
| 2015 | $2,880 | $164,200 | $68,800 | $95,400 |
| 2014 | $1,440 | $164,200 | $68,800 | $95,400 |
Source: Public Records
Map
Nearby Homes
- 128 Ann St
- 18 Devlin Dr
- 143 Royal St
- 2085 Memorial Dr
- 15 Hudson Ave
- 90 Anson St
- 341 Montcalm St
- 61 Saint Jacques Ave
- 41 Susan Ave
- 81 Mccarthy Ave
- 523 James St
- 10 Shadow Brook Estate
- 35 Ludlow Rd
- 25 Shadow Brook Estates Unit 25
- 0 Granby Rd
- 5 Marion St
- 24 Grandview St
- 180 Fletcher Cir
- 1153 James St
- 104 Johnson Rd Unit 1103
- 35 Fillmore St
- 53 Fillmore St
- 29 Fillmore St
- 29 Fillmore St Unit 29
- 40 Fillmore St
- 365 New Ludlow Rd
- 367 New Ludlow Rd
- 335 New Ludlow Rd
- LOT B Old Fuller Rd
- lot 0 Harding St
- LOT 6 Lariviere Dr
- LOT B Old Fuller rd Extension
- LOT 5 Fuller Rd
- LOT D Coolidge
- LOT C Gardner
- L12&13 Marble Ave
- LOT 13 Gaspee St
- LOT A Irene St
- PARCEL A Oldfield Rd
- LOT 1 Anson St
Your Personal Tour Guide
Ask me questions while you tour the home.