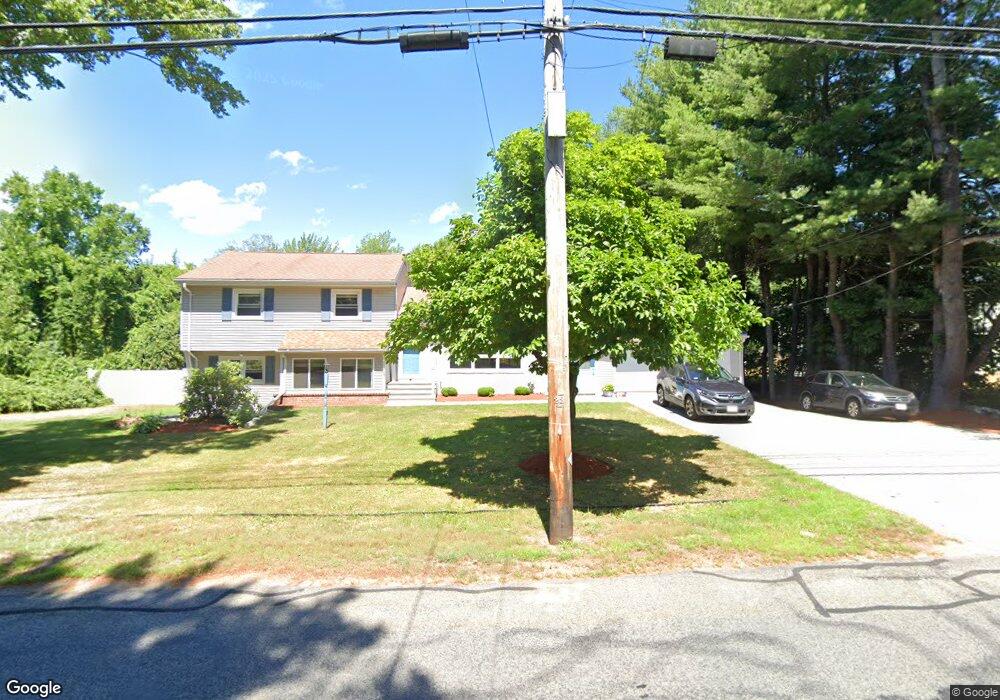
41 Fisher St Westborough, MA 01581
Estimated Value: $649,225 - $777,000
3
Beds
2
Baths
1,400
Sq Ft
$498/Sq Ft
Est. Value
About This Home
This home is located at 41 Fisher St, Westborough, MA 01581 and is currently estimated at $697,056, approximately $497 per square foot. 41 Fisher St is a home located in Worcester County with nearby schools including Westborough High School, Ebridge Montessori School, and Westboro Knowledge Beginnings.
Ownership History
Date
Name
Owned For
Owner Type
Purchase Details
Closed on
Jul 14, 2017
Sold by
Sullivan Mark D and Keene Phyllis
Bought by
Klimavich Michael
Current Estimated Value
Home Financials for this Owner
Home Financials are based on the most recent Mortgage that was taken out on this home.
Original Mortgage
$400,287
Outstanding Balance
$333,027
Interest Rate
3.94%
Mortgage Type
New Conventional
Estimated Equity
$364,029
Purchase Details
Closed on
Mar 30, 1999
Sold by
Rocheleau H Louis and Rocheleau Cheryl L
Bought by
Ferretti Dino and Ferretti Debra
Purchase Details
Closed on
Jun 28, 1991
Sold by
Dalton William H and Dalton Joyce E
Bought by
Rocheleau H Louis and Rochleau Cheryl
Create a Home Valuation Report for This Property
The Home Valuation Report is an in-depth analysis detailing your home's value as well as a comparison with similar homes in the area
Home Values in the Area
Average Home Value in this Area
Purchase History
| Date | Buyer | Sale Price | Title Company |
|---|---|---|---|
| Klimavich Michael | $412,200 | -- | |
| Ferretti Dino | $211,000 | -- | |
| Rocheleau H Louis | $155,000 | -- |
Source: Public Records
Mortgage History
| Date | Status | Borrower | Loan Amount |
|---|---|---|---|
| Open | Klimavich Michael | $400,287 | |
| Previous Owner | Rocheleau H Louis | $25,000 | |
| Previous Owner | Rocheleau H Louis | $224,000 | |
| Previous Owner | Rocheleau H Louis | $66,000 |
Source: Public Records
Tax History Compared to Growth
Tax History
| Year | Tax Paid | Tax Assessment Tax Assessment Total Assessment is a certain percentage of the fair market value that is determined by local assessors to be the total taxable value of land and additions on the property. | Land | Improvement |
|---|---|---|---|---|
| 2025 | $7,919 | $486,100 | $247,700 | $238,400 |
| 2024 | $7,874 | $479,800 | $230,500 | $249,300 |
| 2023 | $7,566 | $449,300 | $218,500 | $230,800 |
| 2022 | $6,950 | $375,900 | $174,000 | $201,900 |
| 2021 | $6,621 | $357,100 | $155,200 | $201,900 |
| 2020 | $6,780 | $370,100 | $161,500 | $208,600 |
| 2019 | $6,196 | $338,000 | $161,500 | $176,500 |
| 2018 | $5,392 | $292,100 | $150,500 | $141,600 |
| 2017 | $5,199 | $292,100 | $150,500 | $141,600 |
| 2016 | $5,089 | $286,400 | $142,600 | $143,800 |
| 2015 | $5,281 | $284,100 | $142,600 | $141,500 |
Source: Public Records
Map
Nearby Homes
- 19 Fisher St
- 6 Folly Ln
- 43 Church St
- 22 Treetop Park
- 52 Treetop Park Unit 52
- 4403 Peters Farm Way Unit 403
- 155 Milk St Unit 5
- 155 Milk St Unit 27
- 9 Treetop Park
- 19 Treetop Park Unit 19
- 9 Shaker Way
- 8 Stagecoach Cir Unit 8
- 48 High Street Extension
- 14 Grove St Unit 2
- 3 Dover Way
- 7 Mayberry Dr Unit H
- 7 Jennings Rd
- 196 -198 Turnpike Rd
- 14 Mayberry Dr Unit 10
- 21 South St Unit 31