Estimated Value: $509,000 - $733,000
--
Bed
1
Bath
4,631
Sq Ft
$125/Sq Ft
Est. Value
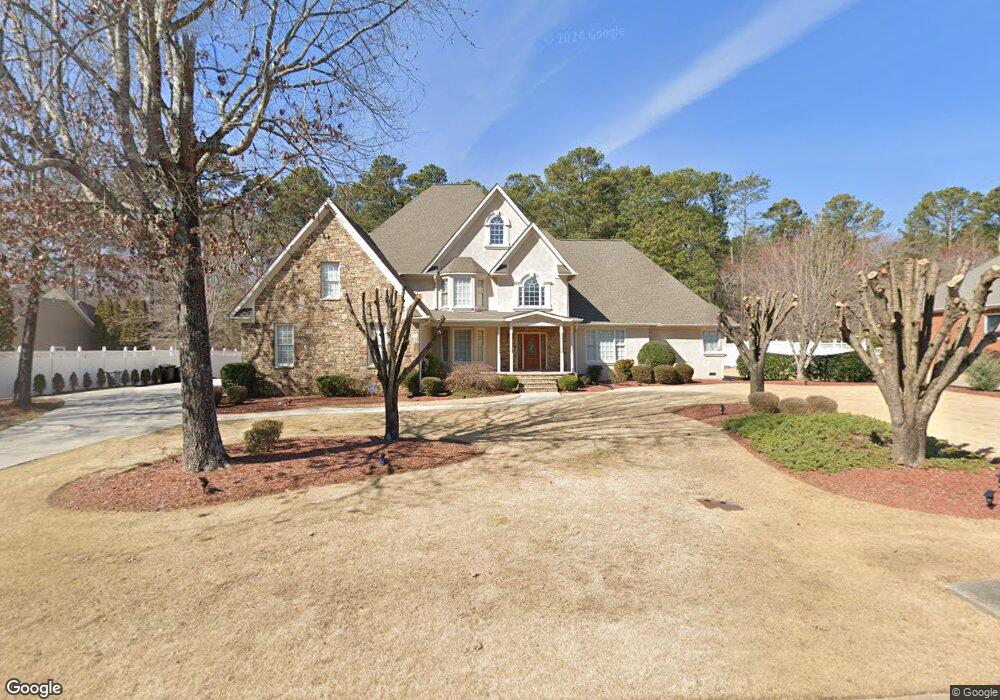
About This Home
This home is located at 41 Fox Croft Rd NW, Rome, GA 30165 and is currently estimated at $578,811, approximately $124 per square foot. 41 Fox Croft Rd NW is a home located in Floyd County with nearby schools including Rome High School.
Ownership History
Date
Name
Owned For
Owner Type
Purchase Details
Closed on
Sep 19, 2005
Sold by
Santos Edguard
Bought by
Santos Edguard and Santos Eva E
Current Estimated Value
Purchase Details
Closed on
Oct 21, 2003
Sold by
Santos Edguard
Bought by
Santos Edguard and Santos Eva E
Purchase Details
Closed on
Oct 17, 2003
Sold by
Barnes Jimmy H and Barnes Jeanette L
Bought by
Santos Edguard
Purchase Details
Closed on
Oct 8, 1996
Sold by
Garden Lakes Company Inc The
Bought by
Barnes Jimmy H and Barnes Jeanette L
Purchase Details
Closed on
Oct 31, 1995
Sold by
Windspec Inc
Bought by
Garden Lakes Company Inc The
Purchase Details
Closed on
Aug 7, 1984
Bought by
Windspec Inc
Create a Home Valuation Report for This Property
The Home Valuation Report is an in-depth analysis detailing your home's value as well as a comparison with similar homes in the area
Home Values in the Area
Average Home Value in this Area
Purchase History
| Date | Buyer | Sale Price | Title Company |
|---|---|---|---|
| Santos Edguard | -- | -- | |
| Santos Edguard | -- | -- | |
| Santos Edguard | -- | -- | |
| Santos Edguard | $370,000 | -- | |
| Barnes Jimmy H | $22,000 | -- | |
| Garden Lakes Company Inc The | -- | -- | |
| Windspec Inc | -- | -- |
Source: Public Records
Tax History Compared to Growth
Tax History
| Year | Tax Paid | Tax Assessment Tax Assessment Total Assessment is a certain percentage of the fair market value that is determined by local assessors to be the total taxable value of land and additions on the property. | Land | Improvement |
|---|---|---|---|---|
| 2024 | $7,209 | $239,346 | $12,600 | $226,746 |
| 2023 | $7,153 | $233,047 | $12,600 | $220,447 |
| 2022 | $6,651 | $197,672 | $12,000 | $185,672 |
| 2021 | $6,471 | $181,090 | $12,000 | $169,090 |
| 2020 | $6,082 | $163,874 | $12,000 | $151,874 |
| 2019 | $5,750 | $156,606 | $12,000 | $144,606 |
| 2018 | $5,475 | $149,178 | $12,000 | $137,178 |
| 2017 | $5,329 | $145,213 | $12,000 | $133,213 |
| 2016 | $5,232 | $142,169 | $12,000 | $130,169 |
| 2015 | $4,941 | $142,169 | $12,000 | $130,169 |
| 2014 | $4,941 | $142,169 | $12,000 | $130,169 |
Source: Public Records
Map
Nearby Homes
- 48 Fox Croft Rd NW
- 31 Williamsburg Dr NW
- 212 Rolling Oaks Dr NW
- 3605 Garden Lakes Pkwy
- 26 Williamsburg Dr NW
- 201 Rollingwood Cir NW
- 224 Rolling Oaks Dr NW
- 8 Tall Pines Terrace NW
- 106 Eden Dr NW
- 16 Polaris Terrace NW
- 16 Drexel Dr NW
- 7 Eden Dr NW
- 124 Beech Creek Dr NW
- 3105 Barker Rd SW
- 9 N Haven Dr
- 8 Ridge Haven Dr NW
- 8 N Haven Dr
- 45 Fox Croft Rd NW
- 37 Fox Croft Rd NW
- 49 Fox Croft Rd NW
- 40 Fox Croft Rd NW
- 44 Fox Croft Rd NW
- 36 Fox Croft Rd NW
- 33 Fox Croft Rd NW
- 48 Fox Haven Rd NW
- 0 Fox Croft Rd Unit 7536927
- 0 Fox Croft Rd Unit 10504633
- 0 Fox Croft Rd Unit 7481419
- 0 Fox Croft Rd Unit 10411949
- 0 Fox Croft Rd Unit 8521503
- 0 Fox Croft Rd Unit 8559339
- 0 Fox Croft Rd Unit 8502233
- 0 Fox Croft Rd Unit 7567777
- 0 Fox Croft Rd Unit 7381321
- 0 Fox Croft Rd Unit 2458027
- 0 Fox Croft Rd
- 53 Fox Croft Rd NW