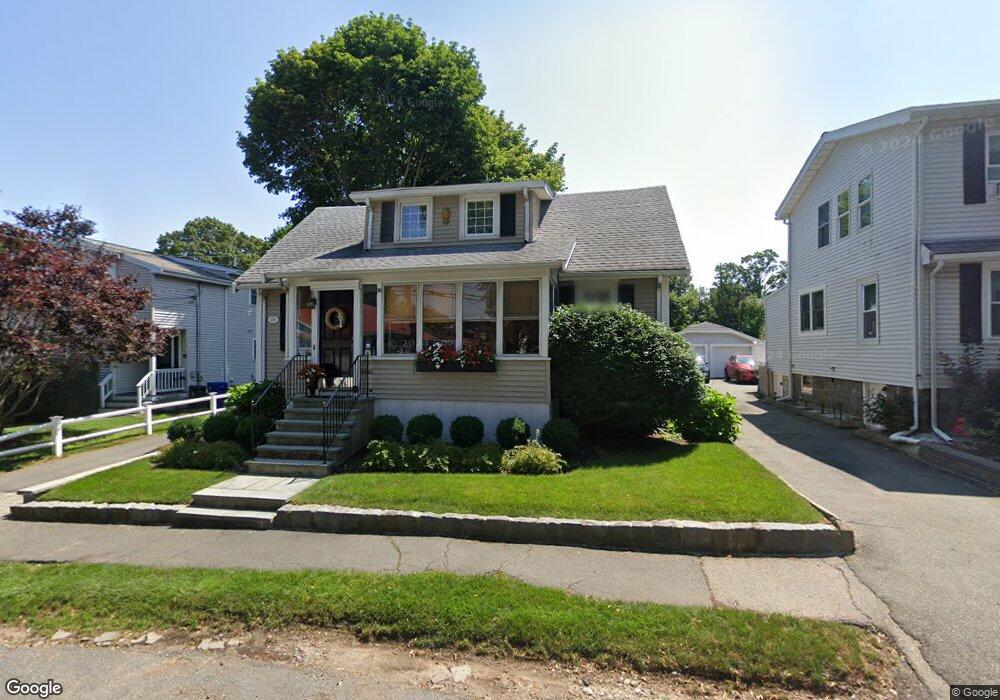
41 Franklin St Milton, MA 02186
Estimated Value: $827,000 - $1,049,000
3
Beds
3
Baths
1,760
Sq Ft
$526/Sq Ft
Est. Value
About This Home
This home is located at 41 Franklin St, Milton, MA 02186 and is currently estimated at $926,492, approximately $526 per square foot. 41 Franklin St is a home located in Norfolk County with nearby schools including Milton High School, St. Agatha School, and Adams Montessori School.
Ownership History
Date
Name
Owned For
Owner Type
Purchase Details
Closed on
Apr 5, 2023
Sold by
Harrington Richard J and Harrington Carol M
Bought by
Carol J Harrington Ret
Current Estimated Value
Purchase Details
Closed on
Jun 30, 1994
Sold by
Thorndike Constn Corp
Bought by
Stevens James P and Stevens Paula J
Home Financials for this Owner
Home Financials are based on the most recent Mortgage that was taken out on this home.
Original Mortgage
$92,000
Interest Rate
8.55%
Mortgage Type
Purchase Money Mortgage
Create a Home Valuation Report for This Property
The Home Valuation Report is an in-depth analysis detailing your home's value as well as a comparison with similar homes in the area
Purchase History
| Date | Buyer | Sale Price | Title Company |
|---|---|---|---|
| Carol J Harrington Ret | -- | None Available | |
| Stevens James P | $196,750 | -- |
Source: Public Records
Mortgage History
| Date | Status | Borrower | Loan Amount |
|---|---|---|---|
| Previous Owner | Stevens James P | $92,000 |
Source: Public Records
Tax History
| Year | Tax Paid | Tax Assessment Tax Assessment Total Assessment is a certain percentage of the fair market value that is determined by local assessors to be the total taxable value of land and additions on the property. | Land | Improvement |
|---|---|---|---|---|
| 2025 | $9,116 | $822,000 | $462,800 | $359,200 |
| 2024 | $8,971 | $821,500 | $440,800 | $380,700 |
| 2023 | $8,933 | $783,600 | $420,000 | $363,600 |
| 2022 | $8,764 | $702,800 | $420,000 | $282,800 |
| 2021 | $8,364 | $637,000 | $367,500 | $269,500 |
| 2020 | $7,616 | $580,500 | $316,900 | $263,600 |
| 2019 | $7,428 | $563,600 | $307,700 | $255,900 |
| 2018 | $7,145 | $517,400 | $266,200 | $251,200 |
| 2017 | $6,685 | $493,000 | $253,500 | $239,500 |
| 2016 | $6,585 | $487,800 | $253,500 | $234,300 |
| 2015 | $6,527 | $468,200 | $233,500 | $234,700 |
Source: Public Records
Map
Nearby Homes
- 440 Granite Ave Unit 201
- 41 Wallace Rd
- 30 Elmwood Park
- 165 Milton St
- 33 Bishop Rd Unit 33
- 169 Pine St
- 134 Sherman St
- 97 Cliff St
- 14 Hall Place Unit 2
- 60 Montclair Ave
- 28 Sagamore Ave
- 125 Lincoln Ave
- 98 Safford St
- 267-269 Farrington St
- 157 Beale St Unit 6
- 45 Holbrook Rd
- 115 W Squantum St Unit 203
- 356 Quarry St
- 121 Prospect Ave
- 85 Forbes Rd
Your Personal Tour Guide
Ask me questions while you tour the home.