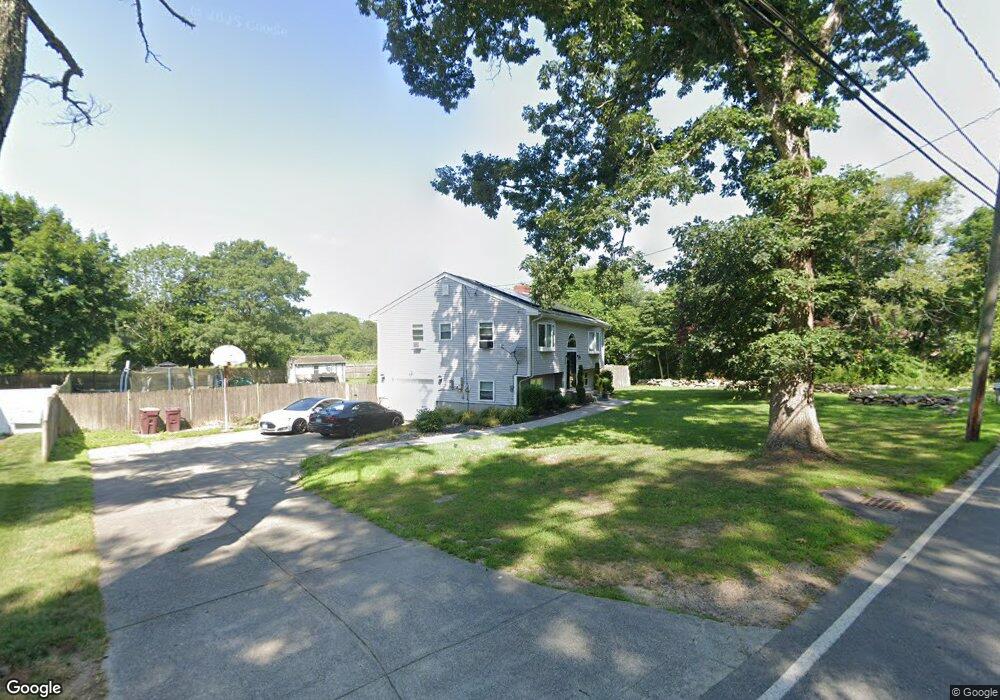
41 Gammons Rd Acushnet, MA 02743
Upper Acushnet NeighborhoodEstimated Value: $426,000 - $619,000
3
Beds
2
Baths
2,199
Sq Ft
$244/Sq Ft
Est. Value
About This Home
This home is located at 41 Gammons Rd, Acushnet, MA 02743 and is currently estimated at $537,441, approximately $244 per square foot. 41 Gammons Rd is a home located in Bristol County with nearby schools including Acushnet Elementary School, Albert F Ford Middle School, and St Francis Xavier Elementary School.
Ownership History
Date
Name
Owned For
Owner Type
Purchase Details
Closed on
Sep 1, 2009
Sold by
Demello Stacey and Demello Edward J
Bought by
Amaral Christopher R and Amaral Jocelyn B
Current Estimated Value
Home Financials for this Owner
Home Financials are based on the most recent Mortgage that was taken out on this home.
Original Mortgage
$239,700
Outstanding Balance
$156,604
Interest Rate
5.17%
Mortgage Type
Purchase Money Mortgage
Estimated Equity
$380,837
Purchase Details
Closed on
Jun 4, 1999
Sold by
Magalhaes Osvaldo S and Magalhaes Allison M
Bought by
Atkinston Stacey and Demello Edward J
Create a Home Valuation Report for This Property
The Home Valuation Report is an in-depth analysis detailing your home's value as well as a comparison with similar homes in the area
Home Values in the Area
Average Home Value in this Area
Purchase History
| Date | Buyer | Sale Price | Title Company |
|---|---|---|---|
| Amaral Christopher R | $235,000 | -- | |
| Atkinston Stacey | $153,750 | -- |
Source: Public Records
Mortgage History
| Date | Status | Borrower | Loan Amount |
|---|---|---|---|
| Open | Atkinston Stacey | $239,700 | |
| Previous Owner | Atkinston Stacey | $15,000 |
Source: Public Records
Tax History
| Year | Tax Paid | Tax Assessment Tax Assessment Total Assessment is a certain percentage of the fair market value that is determined by local assessors to be the total taxable value of land and additions on the property. | Land | Improvement |
|---|---|---|---|---|
| 2025 | $41 | $380,000 | $105,800 | $274,200 |
| 2024 | $4,060 | $355,800 | $101,200 | $254,600 |
| 2023 | $4,006 | $333,800 | $92,000 | $241,800 |
| 2022 | $3,631 | $273,600 | $87,400 | $186,200 |
| 2021 | $3,694 | $267,100 | $87,400 | $179,700 |
| 2020 | $3,723 | $267,100 | $87,400 | $179,700 |
| 2019 | $3,712 | $261,800 | $87,400 | $174,400 |
| 2018 | $3,601 | $249,700 | $87,400 | $162,300 |
| 2017 | $3,500 | $242,400 | $87,400 | $155,000 |
| 2016 | $3,332 | $229,300 | $87,400 | $141,900 |
| 2015 | $3,074 | $215,300 | $87,400 | $127,900 |
Source: Public Records
Map
Nearby Homes
- 489 Main St
- 0 Land Way Unit 73479153
- 363 Main St
- 224 North St
- 7 Laura Ln
- 25 Pershing Ave
- 1 Rounseville Rd
- 23 Oliveira Ave
- 0 Hathaway Rd Unit 73469544
- 41 Chershire Ave
- 12 White St
- 329 Middle Rd
- 11 Boylston St
- 7 Hamlin St
- 14 Hayes St Unit 1
- 12 Hayes St Unit 1
- 134 Nyes Ln
- 23 Coury Dr
- 9 Monmouth St
- 27 Meadow Ln
Your Personal Tour Guide
Ask me questions while you tour the home.