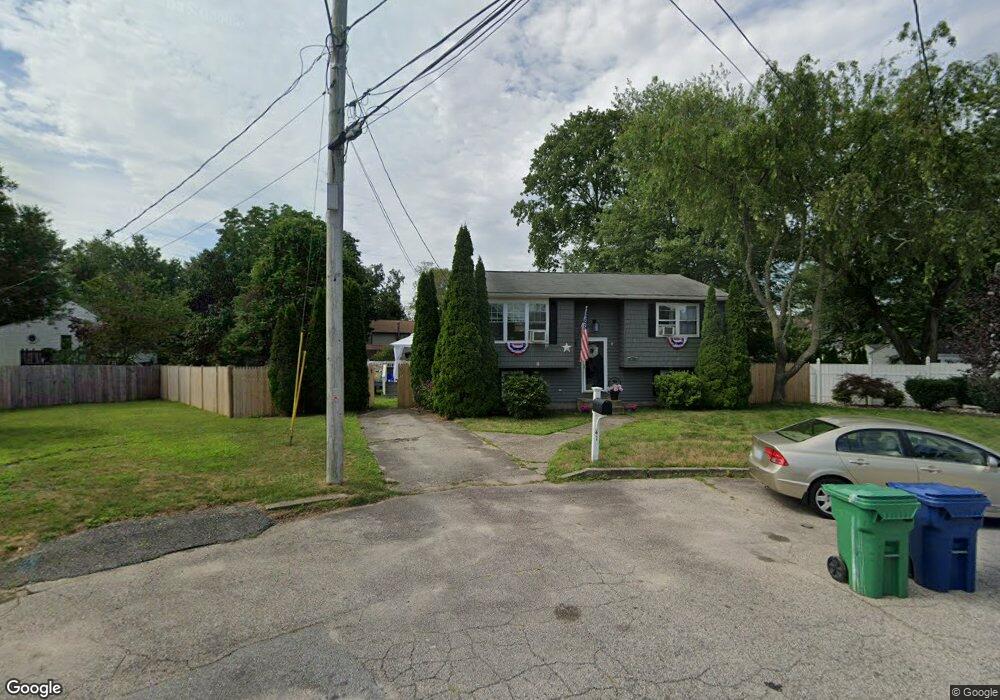
41 Gateway Ct Warwick, RI 02889
Hoxie NeighborhoodEstimated Value: $395,037 - $464,000
2
Beds
3
Baths
872
Sq Ft
$484/Sq Ft
Est. Value
About This Home
This home is located at 41 Gateway Ct, Warwick, RI 02889 and is currently estimated at $422,259, approximately $484 per square foot. 41 Gateway Ct is a home located in Kent County with nearby schools including Saint Kevin School and Bishop Hendricken High School.
Ownership History
Date
Name
Owned For
Owner Type
Purchase Details
Closed on
Jun 30, 2022
Sold by
Vincent Marcia L
Bought by
Vincent Marcia L
Current Estimated Value
Purchase Details
Closed on
Apr 26, 2013
Sold by
Marquez Antonio M and Vincent Marcia L
Bought by
Vincent Marcia L
Purchase Details
Closed on
Oct 19, 1992
Sold by
Levine Patricia L
Bought by
Marquez Antonio M and Vincent Marcia L
Home Financials for this Owner
Home Financials are based on the most recent Mortgage that was taken out on this home.
Original Mortgage
$107,450
Interest Rate
7.93%
Mortgage Type
Purchase Money Mortgage
Create a Home Valuation Report for This Property
The Home Valuation Report is an in-depth analysis detailing your home's value as well as a comparison with similar homes in the area
Home Values in the Area
Average Home Value in this Area
Purchase History
| Date | Buyer | Sale Price | Title Company |
|---|---|---|---|
| Vincent Marcia L | -- | None Available | |
| Vincent Marcia L | -- | -- | |
| Marquez Antonio M | $108,000 | -- | |
| Marquez Antonio M | $108,000 | -- |
Source: Public Records
Mortgage History
| Date | Status | Borrower | Loan Amount |
|---|---|---|---|
| Previous Owner | Marquez Antonio M | $73,202 | |
| Previous Owner | Marquez Antonio M | $107,450 |
Source: Public Records
Tax History
| Year | Tax Paid | Tax Assessment Tax Assessment Total Assessment is a certain percentage of the fair market value that is determined by local assessors to be the total taxable value of land and additions on the property. | Land | Improvement |
|---|---|---|---|---|
| 2025 | $4,596 | $361,900 | $105,600 | $256,300 |
| 2024 | $4,473 | $309,100 | $91,800 | $217,300 |
| 2023 | $4,386 | $309,100 | $91,800 | $217,300 |
| 2022 | $4,282 | $228,600 | $64,100 | $164,500 |
| 2021 | $4,282 | $228,600 | $64,100 | $164,500 |
| 2020 | $4,282 | $228,600 | $64,100 | $164,500 |
| 2019 | $4,282 | $228,600 | $64,100 | $164,500 |
| 2018 | $3,840 | $184,600 | $64,100 | $120,500 |
| 2017 | $3,736 | $184,600 | $64,100 | $120,500 |
| 2016 | $3,736 | $184,600 | $64,100 | $120,500 |
| 2015 | $3,200 | $154,200 | $56,700 | $97,500 |
| 2014 | $3,093 | $154,200 | $56,700 | $97,500 |
| 2013 | $3,052 | $154,200 | $56,700 | $97,500 |
Source: Public Records
Map
Nearby Homes
Your Personal Tour Guide
Ask me questions while you tour the home.