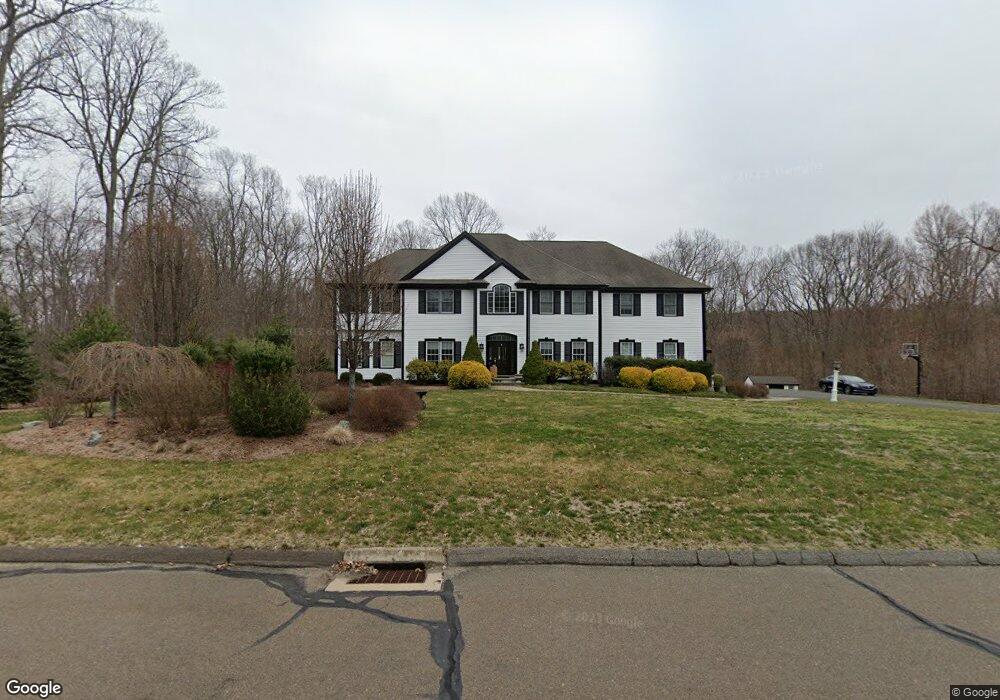
41 Grindstone Ln Monroe, CT 06468
Estimated Value: $1,090,892 - $1,328,000
6
Beds
6
Baths
5,800
Sq Ft
$202/Sq Ft
Est. Value
About This Home
This home is located at 41 Grindstone Ln, Monroe, CT 06468 and is currently estimated at $1,171,973, approximately $202 per square foot. 41 Grindstone Ln is a home located in Fairfield County with nearby schools including Fawn Hollow Elementary School, Jockey Hollow Middle School, and Masuk High School.
Ownership History
Date
Name
Owned For
Owner Type
Purchase Details
Closed on
Nov 3, 2014
Sold by
Nechols Marie and Dejesus Evelyn
Bought by
Lazor George and Lazor Charlotte
Current Estimated Value
Purchase Details
Closed on
Aug 8, 2011
Sold by
Sicilia Kelly A
Bought by
Nichols Marie and Dejesus Evelyn
Home Financials for this Owner
Home Financials are based on the most recent Mortgage that was taken out on this home.
Original Mortgage
$568,000
Interest Rate
4.51%
Purchase Details
Closed on
Feb 27, 2003
Sold by
Gustafson Craeg and Gustafson Wendy
Bought by
Sicilia Mark R and Sicilia Kelly
Purchase Details
Closed on
Nov 21, 2001
Sold by
Home Bldg Const Co
Bought by
Gustafson Craig and Gustafson Wendy
Purchase Details
Closed on
Oct 1, 1999
Sold by
Jans Land Delvpmt Llc
Bought by
Miko Wm S and Miko Judith M
Create a Home Valuation Report for This Property
The Home Valuation Report is an in-depth analysis detailing your home's value as well as a comparison with similar homes in the area
Home Values in the Area
Average Home Value in this Area
Purchase History
| Date | Buyer | Sale Price | Title Company |
|---|---|---|---|
| Lazor George | $702,500 | -- | |
| Lazor George | $702,500 | -- | |
| Nichols Marie | $710,000 | -- | |
| Nichols Marie | $710,000 | -- | |
| Sicilia Mark R | $720,000 | -- | |
| Sicilia Mark R | $720,000 | -- | |
| Gustafson Craig | $727,000 | -- | |
| Gustafson Craig | $727,000 | -- | |
| Miko Wm S | $165,900 | -- | |
| Miko Wm S | $165,900 | -- |
Source: Public Records
Mortgage History
| Date | Status | Borrower | Loan Amount |
|---|---|---|---|
| Previous Owner | Miko Wm S | $568,000 | |
| Previous Owner | Miko Wm S | $568,000 |
Source: Public Records
Tax History
| Year | Tax Paid | Tax Assessment Tax Assessment Total Assessment is a certain percentage of the fair market value that is determined by local assessors to be the total taxable value of land and additions on the property. | Land | Improvement |
|---|---|---|---|---|
| 2025 | $20,596 | $718,370 | $161,070 | $557,300 |
| 2024 | $18,450 | $482,100 | $133,700 | $348,400 |
| 2023 | $18,103 | $482,100 | $133,700 | $348,400 |
| 2022 | $17,770 | $482,100 | $133,700 | $348,400 |
| 2021 | $17,529 | $482,100 | $133,700 | $348,400 |
| 2020 | $17,105 | $482,100 | $133,700 | $348,400 |
| 2019 | $17,303 | $486,300 | $130,200 | $356,100 |
| 2018 | $17,137 | $486,300 | $130,200 | $356,100 |
| 2017 | $17,390 | $486,300 | $130,200 | $356,100 |
| 2016 | $17,021 | $486,300 | $130,200 | $356,100 |
| 2015 | $16,704 | $486,300 | $130,200 | $356,100 |
| 2014 | $16,133 | $520,240 | $167,300 | $352,940 |
Source: Public Records
Map
Nearby Homes
- 275-291 Hammertown Rd
- 1115 Monroe Turnpike
- 15 Legacy Ln
- 34 Bagburn Rd
- 3 Serenity Ln
- 65 Trailside Dr Unit 67
- 59 Great Ring Rd
- 124 Bagburn Rd
- 1427 Monroe Turnpike
- 455 Barn Hill Rd
- 39 Bradley Ln
- 49 Great Ring Rd
- 114 Turkey Roost Rd
- 360 Garder Rd
- 13 Jordan Hill Rd Unit Lot 4
- 42 Great Ring Rd
- 40 Great Ring Rd
- 491 Hammertown Rd
- 8 Stone Bridge Trail
- 3 Rowledge Pond Rd
- 29 Grindstone Ln
- 46 Grindstone Ln
- 30 Grindstone Ln Unit 32
- 51 Grindstone Ln
- 11 Grindstone Ln
- 16 Grindstone Ln
- 54 Grist Mill Rd
- 66 Grindstone Ln
- 34 Grist Mill Rd
- 57 Josies Ring Rd
- 64 Grist Mill Rd
- 18 Grist Mill Rd
- 168 Hammertown Rd
- 81 Josies Ring Rd
- 154 Hammertown Rd
- 45 Grist Mill Rd
- 70 Josies Ring Rd
- 56 Josies Ring Rd
- 35 Grist Mill Rd
- 53 Grist Mill Rd
Your Personal Tour Guide
Ask me questions while you tour the home.