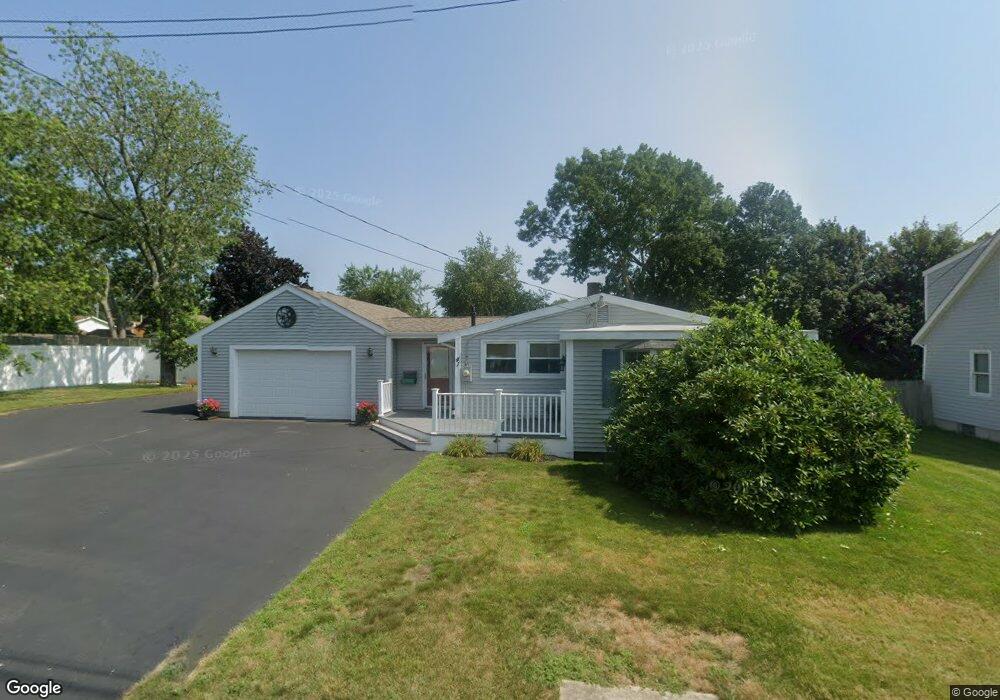
41 Hacker St Fairhaven, MA 02719
Pope Beach NeighborhoodEstimated Value: $342,000 - $513,000
2
Beds
1
Bath
1,090
Sq Ft
$406/Sq Ft
Est. Value
About This Home
This home is located at 41 Hacker St, Fairhaven, MA 02719 and is currently estimated at $442,397, approximately $405 per square foot. 41 Hacker St is a home located in Bristol County with nearby schools including Fairhaven High School, City On A Hill Charter Public School New Bedford, and St. Joseph School.
Ownership History
Date
Name
Owned For
Owner Type
Purchase Details
Closed on
Jun 28, 2023
Sold by
Duckworth Jacqueline T
Bought by
J T Duckworth Ret and Duckworth
Current Estimated Value
Purchase Details
Closed on
Jul 3, 1998
Sold by
Ferreira Doreen C
Bought by
Duckworth Jacqueline
Home Financials for this Owner
Home Financials are based on the most recent Mortgage that was taken out on this home.
Original Mortgage
$71,250
Interest Rate
7.04%
Mortgage Type
Purchase Money Mortgage
Create a Home Valuation Report for This Property
The Home Valuation Report is an in-depth analysis detailing your home's value as well as a comparison with similar homes in the area
Home Values in the Area
Average Home Value in this Area
Purchase History
| Date | Buyer | Sale Price | Title Company |
|---|---|---|---|
| J T Duckworth Ret | -- | None Available | |
| Duckworth Jacqueline | $75,000 | -- |
Source: Public Records
Mortgage History
| Date | Status | Borrower | Loan Amount |
|---|---|---|---|
| Previous Owner | Duckworth Jacqueline | $103,000 | |
| Previous Owner | Duckworth Jacqueline | $85,000 | |
| Previous Owner | Duckworth Jacqueline | $71,250 |
Source: Public Records
Tax History
| Year | Tax Paid | Tax Assessment Tax Assessment Total Assessment is a certain percentage of the fair market value that is determined by local assessors to be the total taxable value of land and additions on the property. | Land | Improvement |
|---|---|---|---|---|
| 2025 | $34 | $362,900 | $176,700 | $186,200 |
| 2024 | $3,171 | $343,500 | $176,700 | $166,800 |
| 2023 | $3,039 | $305,400 | $154,800 | $150,600 |
| 2022 | $2,889 | $282,700 | $143,800 | $138,900 |
| 2021 | $2,765 | $244,900 | $130,100 | $114,800 |
| 2020 | $2,412 | $218,100 | $130,100 | $88,000 |
| 2019 | $2,266 | $194,200 | $107,900 | $86,300 |
| 2018 | $2,168 | $184,500 | $102,700 | $81,800 |
| 2017 | $2,167 | $180,000 | $102,700 | $77,300 |
| 2016 | $2,150 | $176,500 | $102,700 | $73,800 |
| 2015 | $2,127 | $175,100 | $102,700 | $72,400 |
Source: Public Records
Map
Nearby Homes
- 58 Bayview Ave
- 27 Bayview Ave
- 15 Bayview Ave
- 3.5 Golf St
- 190 Sconticut Neck Rd
- 00 Copeland St
- 8 Manor Dr
- 00 Huttleston Ave
- 181 Washington St
- 2 Washburn Ave
- 33 Narragansett Blvd
- 11 Lawton St
- 5 Reservation Rd
- 32 Cedar St
- 145 Pleasant St
- 32 Green St
- 77 Adams St
- 58 Washington St
- 39 Christian St
- 0 Nulands Neck Unit 73286360
Your Personal Tour Guide
Ask me questions while you tour the home.