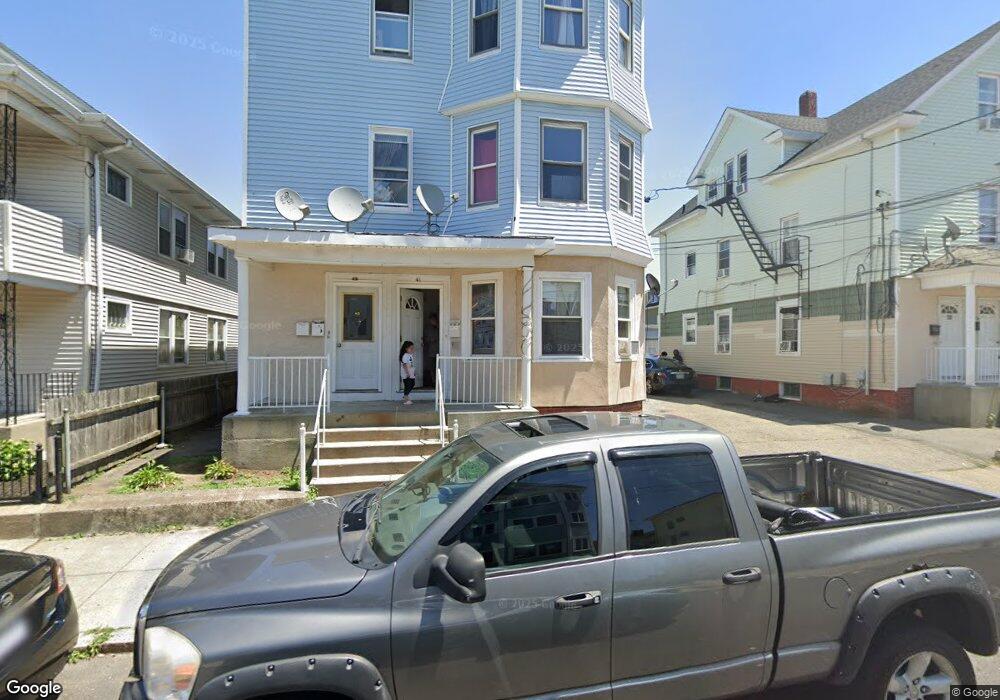
41 Hancock St Pawtucket, RI 02860
Fairlawn NeighborhoodEstimated Value: $377,565 - $657,000
9
Beds
4
Baths
3,444
Sq Ft
$167/Sq Ft
Est. Value
About This Home
This home is located at 41 Hancock St, Pawtucket, RI 02860 and is currently estimated at $576,641, approximately $167 per square foot. 41 Hancock St is a home located in Providence County with nearby schools including International Charter School, Blackstone Valley Prep Junior High School, and Blackstone Academy Charter School.
Ownership History
Date
Name
Owned For
Owner Type
Purchase Details
Closed on
Aug 23, 1999
Sold by
Dasilva Orlindo M
Bought by
Coelho Fernando and Coelho Maria M
Current Estimated Value
Home Financials for this Owner
Home Financials are based on the most recent Mortgage that was taken out on this home.
Original Mortgage
$90,000
Outstanding Balance
$25,290
Interest Rate
7.6%
Estimated Equity
$551,351
Create a Home Valuation Report for This Property
The Home Valuation Report is an in-depth analysis detailing your home's value as well as a comparison with similar homes in the area
Home Values in the Area
Average Home Value in this Area
Purchase History
| Date | Buyer | Sale Price | Title Company |
|---|---|---|---|
| Coelho Fernando | $95,000 | -- |
Source: Public Records
Mortgage History
| Date | Status | Borrower | Loan Amount |
|---|---|---|---|
| Open | Coelho Fernando | $90,000 |
Source: Public Records
Tax History
| Year | Tax Paid | Tax Assessment Tax Assessment Total Assessment is a certain percentage of the fair market value that is determined by local assessors to be the total taxable value of land and additions on the property. | Land | Improvement |
|---|---|---|---|---|
| 2025 | $6,532 | $496,700 | $118,300 | $378,400 |
| 2024 | $6,129 | $496,700 | $118,300 | $378,400 |
| 2023 | $5,467 | $322,700 | $53,200 | $269,500 |
| 2022 | $5,350 | $322,700 | $53,200 | $269,500 |
| 2021 | $5,350 | $322,700 | $53,200 | $269,500 |
| 2020 | $4,452 | $213,100 | $53,900 | $159,200 |
| 2019 | $4,452 | $213,100 | $53,900 | $159,200 |
| 2018 | $4,290 | $213,100 | $53,900 | $159,200 |
| 2017 | $3,960 | $174,300 | $41,000 | $133,300 |
| 2016 | $3,815 | $174,300 | $41,000 | $133,300 |
| 2015 | $3,815 | $174,300 | $41,000 | $133,300 |
| 2014 | $3,228 | $140,000 | $52,700 | $87,300 |
Source: Public Records
Map
Nearby Homes
- 75 Baldwin St
- 75 Larch St
- 27 Lloyd St
- 17 Beecher St
- 193 Harrison St
- 48 Star St
- 76 Slater St
- 35 Hurley Ave
- 14 Martin Ct
- 584 Weeden St
- 546 Lonsdale Ave Unit 548
- 0 Webb St Unit 1406927
- 0 Webb St Unit 73489835
- 59 West Ave
- 53 Samuel Ave
- 107 Mulberry St
- 616 Lonsdale Ave Unit 618
- 57 Garden St
- 45 Harrison St
- 187 Sisson St
Your Personal Tour Guide
Ask me questions while you tour the home.