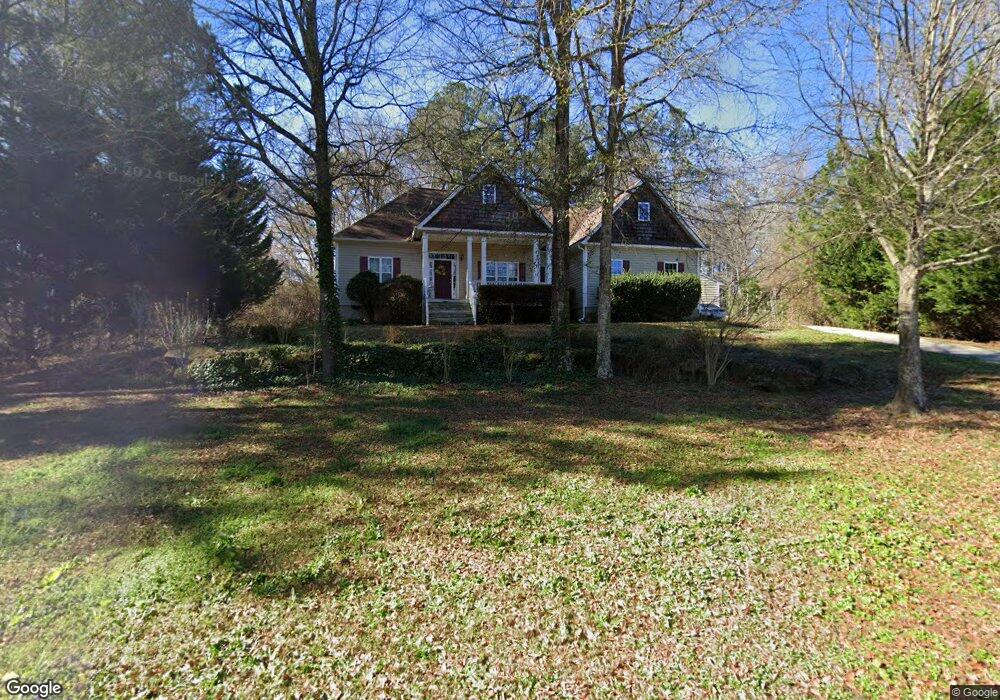
41 Harvest Trace Sharpsburg, GA 30277
Estimated Value: $354,306 - $446,000
3
Beds
3
Baths
2,081
Sq Ft
$193/Sq Ft
Est. Value
About This Home
This home is located at 41 Harvest Trace, Sharpsburg, GA 30277 and is currently estimated at $402,077, approximately $193 per square foot. 41 Harvest Trace is a home located in Coweta County with nearby schools including Willis Road Elementary School, Lee Middle School, and East Coweta High School.
Ownership History
Date
Name
Owned For
Owner Type
Purchase Details
Closed on
Oct 14, 2015
Sold by
Hoffman Richard J
Bought by
Hoffman Richard J and Hoffman Nell C
Current Estimated Value
Purchase Details
Closed on
Jul 26, 2006
Sold by
Petersen Larry A
Bought by
Hoffman Richard J
Home Financials for this Owner
Home Financials are based on the most recent Mortgage that was taken out on this home.
Original Mortgage
$175,920
Interest Rate
6.6%
Mortgage Type
New Conventional
Purchase Details
Closed on
Mar 4, 2005
Sold by
Watkin Robert A and Watkin Nancy
Bought by
Peterson Larry A
Home Financials for this Owner
Home Financials are based on the most recent Mortgage that was taken out on this home.
Original Mortgage
$30,000
Interest Rate
5.6%
Mortgage Type
New Conventional
Purchase Details
Closed on
Mar 18, 1992
Bought by
Watkin Robert B & Na
Purchase Details
Closed on
Dec 31, 1972
Bought by
Foster Bliss W
Create a Home Valuation Report for This Property
The Home Valuation Report is an in-depth analysis detailing your home's value as well as a comparison with similar homes in the area
Home Values in the Area
Average Home Value in this Area
Purchase History
| Date | Buyer | Sale Price | Title Company |
|---|---|---|---|
| Hoffman Richard J | -- | -- | |
| Hoffman Richard J | $219,900 | -- | |
| Peterson Larry A | $40,000 | -- | |
| Watkin Robert B & Na | $33,500 | -- | |
| Foster Bliss W | $116,000 | -- |
Source: Public Records
Mortgage History
| Date | Status | Borrower | Loan Amount |
|---|---|---|---|
| Previous Owner | Hoffman Richard J | $175,920 | |
| Previous Owner | Peterson Larry A | $30,000 |
Source: Public Records
Tax History Compared to Growth
Tax History
| Year | Tax Paid | Tax Assessment Tax Assessment Total Assessment is a certain percentage of the fair market value that is determined by local assessors to be the total taxable value of land and additions on the property. | Land | Improvement |
|---|---|---|---|---|
| 2025 | $1,722 | $149,948 | $28,000 | $121,948 |
| 2024 | $1,517 | $142,877 | $20,000 | $122,877 |
| 2023 | $1,517 | $139,744 | $20,000 | $119,744 |
| 2022 | $1,284 | $128,273 | $20,000 | $108,273 |
| 2021 | $840 | $95,865 | $14,000 | $81,865 |
| 2020 | $1,028 | $95,865 | $14,000 | $81,865 |
| 2019 | $1,475 | $90,402 | $16,000 | $74,402 |
| 2018 | $2,559 | $90,402 | $16,000 | $74,402 |
| 2017 | $1,124 | $90,967 | $14,000 | $76,967 |
| 2016 | $832 | $81,836 | $10,000 | $71,836 |
| 2015 | $658 | $71,574 | $10,000 | $61,574 |
| 2014 | $540 | $61,312 | $10,000 | $51,312 |
Source: Public Records
Map
Nearby Homes
- 5 Timber Walk Place
- 160 Old Field Rd
- 20 Platinum Ridge
- 90 Spring Forest Trail
- 435 Mapledale Trail
- 150 Park Timbers Dr
- 0 Pinegate Way Unit 10436279
- 0 Spring Forest Way Unit LOT 2-1 10483749
- Spring Forest Way Lot: 2-1
- 430 Mapledale Trail
- 185 Mapledale Trail
- 4791 Highway 34 E
- 3771 Highway 34 E Unit TRACT2
- 3771 Highway 34 E Unit TRACT1
- 185 Grand Jct
- 190 Willow Lake Ln
- 135 Willow Lake Ln
- 165 Bartlett Dr
- 195 Mapledale Trail Unit 4
- 374 Beaumont Farms Dr
- 29 Harvest Trace
- 83 Harvest Trace
- 8 Market Cir
- 107 Harvest Trace
- 10 Amber Way
- 21 Amber Way
- 135 Harvest Trace
- 9 Market Cir
- 22 Market Cir
- LOT 33 Harvest Trace Unit 133 6101 073 PARCEL
- 125 Harvest Trace
- 96 Harvest Trace
- 29 Amber Way
- 32 Market Cir
- 21 Market Cir
- 95 E Plantation Dr
- 100 E Plantation Dr
- 118 Harvest Trace
- 4308 Highway 34 E
- 37 Market Cir