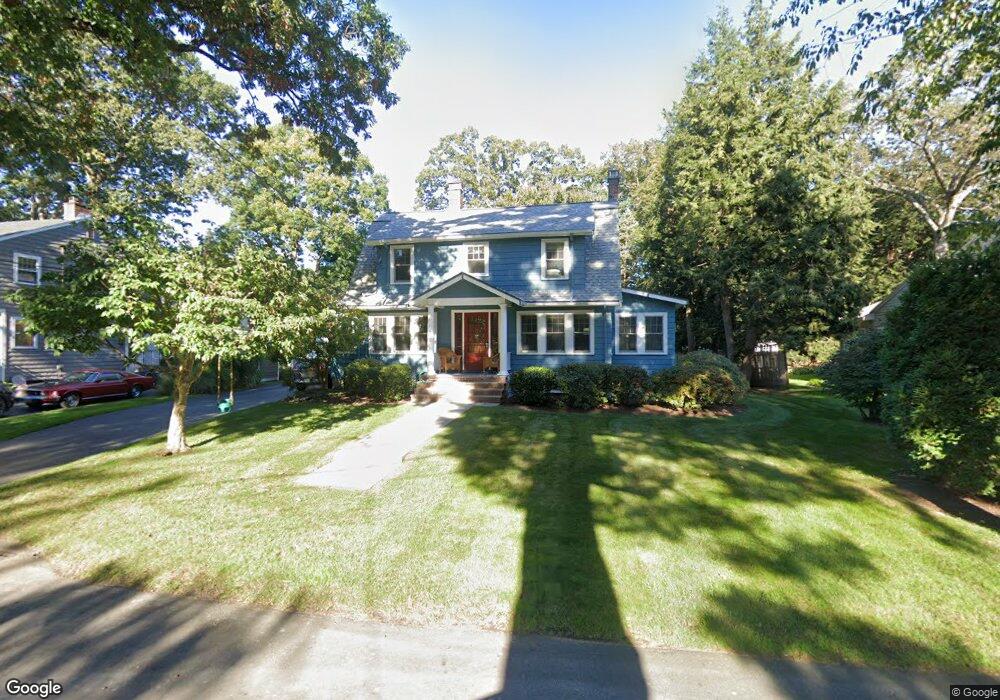
41 Hemlock St Needham, MA 02492
Estimated Value: $1,414,331 - $1,681,000
4
Beds
2
Baths
1,287
Sq Ft
$1,200/Sq Ft
Est. Value
About This Home
This home is located at 41 Hemlock St, Needham, MA 02492 and is currently estimated at $1,544,833, approximately $1,200 per square foot. 41 Hemlock St is a home located in Norfolk County with nearby schools including Mitchell Elementary School, High Rock Middle School, and Pollard Middle School.
Ownership History
Date
Name
Owned For
Owner Type
Purchase Details
Closed on
Jun 23, 2017
Sold by
Pevar Jan S and Ram Neil M
Bought by
Jan S Pevar 1989 T
Current Estimated Value
Purchase Details
Closed on
Jun 20, 1986
Bought by
Ram Neil M and Pevar Jan S
Create a Home Valuation Report for This Property
The Home Valuation Report is an in-depth analysis detailing your home's value as well as a comparison with similar homes in the area
Home Values in the Area
Average Home Value in this Area
Purchase History
| Date | Buyer | Sale Price | Title Company |
|---|---|---|---|
| Jan S Pevar 1989 T | -- | -- | |
| Ram Neil M | $269,000 | -- |
Source: Public Records
Mortgage History
| Date | Status | Borrower | Loan Amount |
|---|---|---|---|
| Previous Owner | Ram Neil M | $152,000 | |
| Previous Owner | Ram Neil M | $216,000 | |
| Previous Owner | Ram Neil M | $60,000 | |
| Previous Owner | Ram Neil M | $169,000 |
Source: Public Records
Tax History Compared to Growth
Tax History
| Year | Tax Paid | Tax Assessment Tax Assessment Total Assessment is a certain percentage of the fair market value that is determined by local assessors to be the total taxable value of land and additions on the property. | Land | Improvement |
|---|---|---|---|---|
| 2025 | $12,081 | $1,139,700 | $800,400 | $339,300 |
| 2024 | $12,286 | $981,300 | $589,200 | $392,100 |
| 2023 | $12,451 | $954,800 | $589,200 | $365,600 |
| 2022 | $11,696 | $874,800 | $521,400 | $353,400 |
| 2021 | $11,399 | $874,800 | $521,400 | $353,400 |
| 2020 | $10,810 | $865,500 | $521,400 | $344,100 |
| 2019 | $10,047 | $810,900 | $474,000 | $336,900 |
| 2018 | $9,633 | $810,900 | $474,000 | $336,900 |
| 2017 | $9,074 | $763,200 | $474,000 | $289,200 |
| 2016 | $8,807 | $763,200 | $474,000 | $289,200 |
| 2015 | $8,617 | $763,200 | $474,000 | $289,200 |
| 2014 | $7,827 | $672,400 | $395,000 | $277,400 |
Source: Public Records
Map
Nearby Homes
- 40 Otis St Unit L
- 62 Washington Ave
- 42 Otis St Unit R
- 190 Brookline St
- 26 Pinewood Rd
- 556 Webster St
- 332 Hillcrest Rd
- 154 Warren St
- 71 School St
- 233 Warren St
- 317 Dedham Ave
- 445 Hillside Ave
- 23 Cheney St
- 1011 Webster St
- 247 Broad Meadow Rd
- 3 Crescent Rd
- 701 Greendale Ave
- 9 Jayne Rd
- 143 Hunting Rd
- 400 Hunnewell St Unit 103