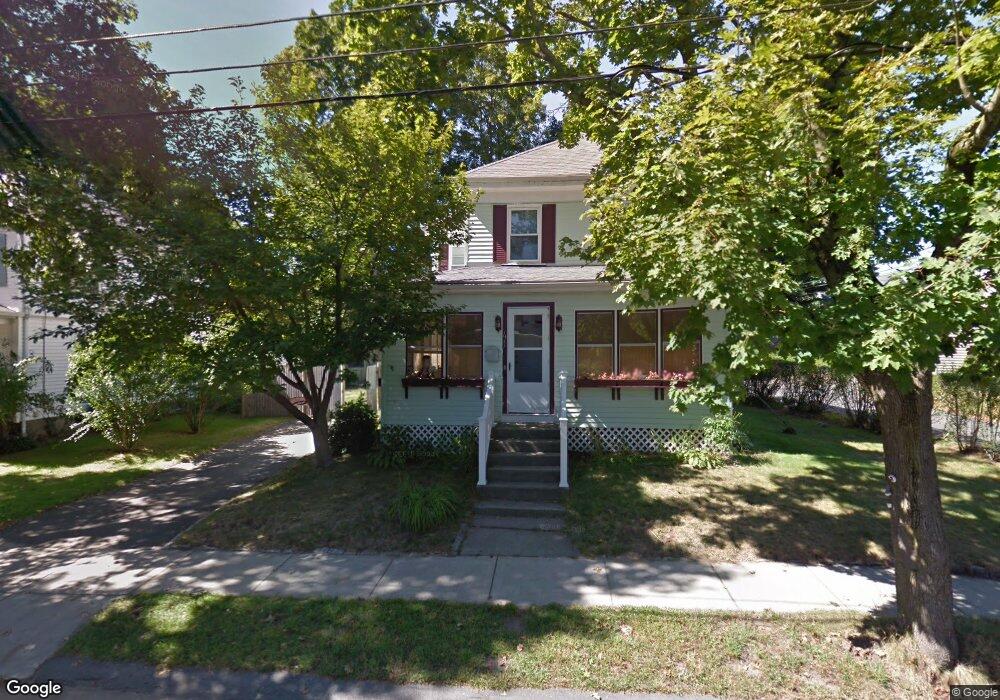
41 High St Natick, MA 01760
Estimated Value: $739,669 - $956,000
3
Beds
2
Baths
1,418
Sq Ft
$588/Sq Ft
Est. Value
About This Home
This home is located at 41 High St, Natick, MA 01760 and is currently estimated at $833,667, approximately $587 per square foot. 41 High St is a home located in Middlesex County with nearby schools including Natick High School, Johnson Elementary School, and J F Kennedy Middle School.
Ownership History
Date
Name
Owned For
Owner Type
Purchase Details
Closed on
Jan 14, 2021
Sold by
Scotch Ruth A and Sosa Luis A
Bought by
Sosa Luis A
Current Estimated Value
Home Financials for this Owner
Home Financials are based on the most recent Mortgage that was taken out on this home.
Original Mortgage
$153,000
Outstanding Balance
$134,877
Interest Rate
2.67%
Mortgage Type
New Conventional
Estimated Equity
$698,790
Purchase Details
Closed on
Nov 25, 2002
Sold by
Clark John R and Clark Tina-Marie
Bought by
Sosa Luis A and Scotch Ruth A
Home Financials for this Owner
Home Financials are based on the most recent Mortgage that was taken out on this home.
Original Mortgage
$200,000
Interest Rate
6.07%
Mortgage Type
Purchase Money Mortgage
Purchase Details
Closed on
Jul 20, 1990
Sold by
Bumbarner John R
Bought by
Clark John R
Create a Home Valuation Report for This Property
The Home Valuation Report is an in-depth analysis detailing your home's value as well as a comparison with similar homes in the area
Home Values in the Area
Average Home Value in this Area
Purchase History
| Date | Buyer | Sale Price | Title Company |
|---|---|---|---|
| Sosa Luis A | -- | None Available | |
| Sosa Luis A | $365,000 | -- | |
| Sosa Luis A | $365,000 | -- | |
| Clark John R | $150,000 | -- |
Source: Public Records
Mortgage History
| Date | Status | Borrower | Loan Amount |
|---|---|---|---|
| Open | Sosa Luis A | $153,000 | |
| Previous Owner | Sosa Luis A | $200,000 | |
| Previous Owner | Clark John R | $143,000 | |
| Previous Owner | Clark John R | $140,000 |
Source: Public Records
Tax History
| Year | Tax Paid | Tax Assessment Tax Assessment Total Assessment is a certain percentage of the fair market value that is determined by local assessors to be the total taxable value of land and additions on the property. | Land | Improvement |
|---|---|---|---|---|
| 2025 | $7,479 | $625,300 | $402,500 | $222,800 |
| 2024 | $7,226 | $589,400 | $380,100 | $209,300 |
| 2023 | $6,991 | $553,100 | $357,800 | $195,300 |
| 2022 | $6,738 | $505,100 | $326,500 | $178,600 |
| 2021 | $6,397 | $476,000 | $308,600 | $167,400 |
| 2020 | $6,184 | $449,200 | $281,800 | $167,400 |
| 2019 | $5,932 | $449,200 | $281,800 | $167,400 |
| 2018 | $5,576 | $427,300 | $268,400 | $158,900 |
| 2017 | $6,016 | $356,800 | $237,000 | $119,800 |
| 2016 | $4,630 | $341,200 | $222,600 | $118,600 |
| 2015 | $4,584 | $331,700 | $222,600 | $109,100 |
Source: Public Records
Map
Nearby Homes
- 25 Forest Ave
- 6 Floral Avenue Extension
- 8 Floral Avenue Extension
- 12 Floral Ave
- 63 Pond St
- 8 Floral Ave Unit 8
- 58 W Central St
- 16 West St
- 62 Oakland St
- 98 W Central St
- 216-218 S Main St
- 14 Pinewood Ave
- 49 Summer St
- 9 Bellevue Rd
- 1 Lincoln Street Extension
- 11 Avon St
- 6A Lincoln St Unit 6A
- 4B Lincoln St Unit 4B
- 5 Wilson St Unit 5A
- 3A Wilson St Unit 3A
Your Personal Tour Guide
Ask me questions while you tour the home.