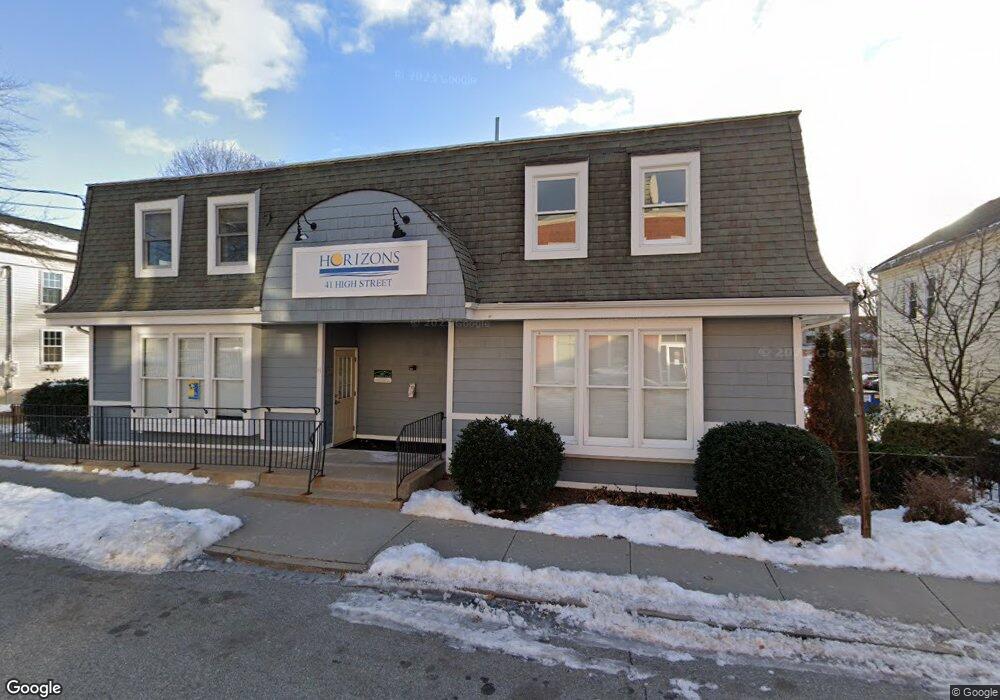
41 High St Willimantic, CT 06226
Estimated Value: $355,819
Studio
--
Bath
3,438
Sq Ft
$103/Sq Ft
Est. Value
About This Home
This home is located at 41 High St, Willimantic, CT 06226 and is currently estimated at $355,819, approximately $103 per square foot. 41 High St is a home located in Windham County with nearby schools including Windham Middle School, Windham High School, and St Mary St Joseph School.
Ownership History
Date
Name
Owned For
Owner Type
Purchase Details
Closed on
Dec 12, 2024
Sold by
Mcgrath Law Prop Llc
Bought by
Horizons Programs Inc
Current Estimated Value
Home Financials for this Owner
Home Financials are based on the most recent Mortgage that was taken out on this home.
Original Mortgage
$246,641
Outstanding Balance
$244,675
Interest Rate
6.72%
Mortgage Type
Purchase Money Mortgage
Estimated Equity
$111,144
Purchase Details
Closed on
Sep 21, 2004
Sold by
Devivo Timothy J and Devivo Kerry Ann
Bought by
Mcgrath Law Propert Ll
Purchase Details
Closed on
Aug 27, 2003
Sold by
Hoffman Gerard Est and Hoffman
Bought by
Devivo Timothy J and Devivo Kerry Ann
Create a Home Valuation Report for This Property
The Home Valuation Report is an in-depth analysis detailing your home's value as well as a comparison with similar homes in the area
Home Values in the Area
Average Home Value in this Area
Purchase History
| Date | Buyer | Sale Price | Title Company |
|---|---|---|---|
| Horizons Programs Inc | $335,000 | None Available | |
| Horizons Programs Inc | $335,000 | None Available | |
| Horizons Programs Inc | $335,000 | None Available | |
| Mcgrath Law Propert Ll | $120,000 | -- | |
| Mcgrath Law Propert Ll | $120,000 | -- | |
| Devivo Timothy J | $40,000 | -- | |
| Devivo Timothy J | $40,000 | -- |
Source: Public Records
Mortgage History
| Date | Status | Borrower | Loan Amount |
|---|---|---|---|
| Open | Horizons Programs Inc | $246,641 | |
| Closed | Horizons Programs Inc | $246,641 | |
| Previous Owner | Devivo Timothy J | $125,000 | |
| Previous Owner | Devivo Timothy J | $100,000 | |
| Previous Owner | Devivo Timothy J | $40,000 |
Source: Public Records
Tax History
| Year | Tax Paid | Tax Assessment Tax Assessment Total Assessment is a certain percentage of the fair market value that is determined by local assessors to be the total taxable value of land and additions on the property. | Land | Improvement |
|---|---|---|---|---|
| 2025 | $5,735 | $154,920 | $31,350 | $123,570 |
| 2024 | $5,741 | $154,920 | $31,350 | $123,570 |
| 2023 | $7,740 | $163,300 | $27,260 | $136,040 |
| 2022 | $7,626 | $163,300 | $27,260 | $136,040 |
| 2021 | $8,180 | $163,300 | $27,260 | $136,040 |
| 2020 | $8,162 | $163,300 | $27,260 | $136,040 |
| 2019 | $8,029 | $163,300 | $27,260 | $136,040 |
| 2017 | $6,855 | $143,990 | $26,330 | $117,660 |
| 2015 | $6,621 | $143,990 | $26,330 | $117,660 |
| 2014 | $6,253 | $143,990 | $26,330 | $117,660 |
Source: Public Records
Map
Nearby Homes
- 15 Strongs Ct
- 242--R Valley St
- 6 High St
- 242R Valley St
- 248 Valley St
- 240 Valley St
- 244 Valley St
- 244 Valley St
- 236 Valley St
- 236 Valley St Unit 4
- 230 Valley St
- 65 High St
- 20 Schoolhouse Ln
- 20 Schoolhouse Ln
- 20 Schoolhouse Ln
- 75 High St
- 931 Main St
- 237 Valley St
- 237 Valley St Unit 30
- 237 Valley St Unit 10
Your Personal Tour Guide
Ask me questions while you tour the home.