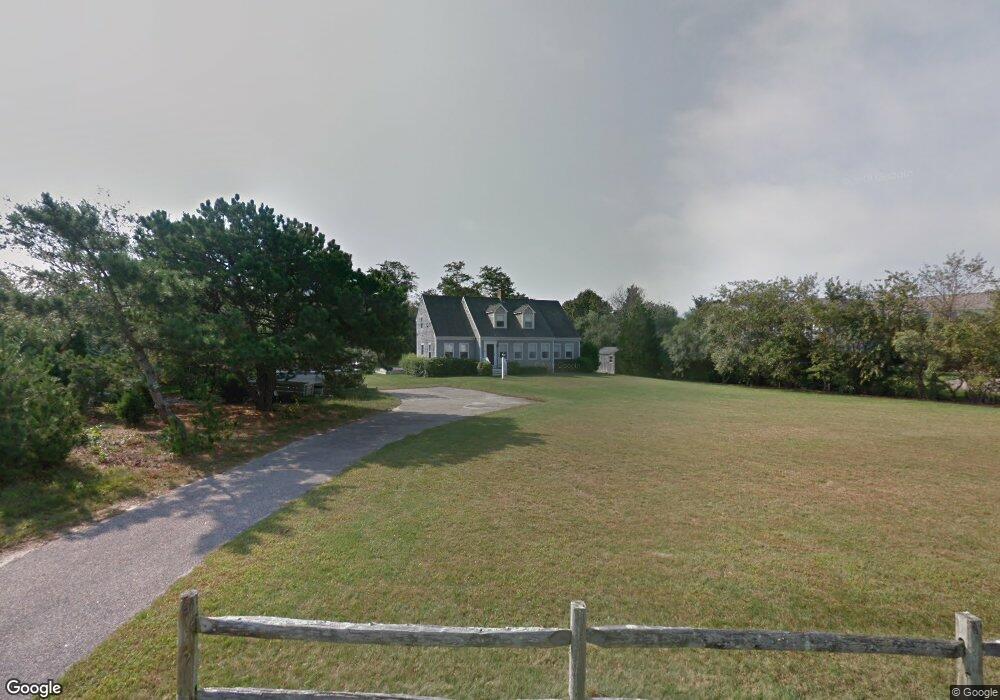
41 Highcrest Rd North Falmouth, MA 02556
Estimated Value: $1,258,000 - $1,624,000
4
Beds
3
Baths
1,572
Sq Ft
$890/Sq Ft
Est. Value
About This Home
This home is located at 41 Highcrest Rd, North Falmouth, MA 02556 and is currently estimated at $1,399,418, approximately $890 per square foot. 41 Highcrest Rd is a home located in Barnstable County with nearby schools including North Falmouth Elementary School, Morse Pond School, and Lawrence School.
Ownership History
Date
Name
Owned For
Owner Type
Purchase Details
Closed on
Jun 16, 1989
Sold by
Troy Leo J
Bought by
Mcnally John F X
Current Estimated Value
Home Financials for this Owner
Home Financials are based on the most recent Mortgage that was taken out on this home.
Original Mortgage
$227,250
Interest Rate
10.87%
Mortgage Type
Purchase Money Mortgage
Create a Home Valuation Report for This Property
The Home Valuation Report is an in-depth analysis detailing your home's value as well as a comparison with similar homes in the area
Home Values in the Area
Average Home Value in this Area
Purchase History
| Date | Buyer | Sale Price | Title Company |
|---|---|---|---|
| Mcnally John F X | $252,500 | -- |
Source: Public Records
Mortgage History
| Date | Status | Borrower | Loan Amount |
|---|---|---|---|
| Closed | Mcnally John F X | $227,250 |
Source: Public Records
Tax History Compared to Growth
Tax History
| Year | Tax Paid | Tax Assessment Tax Assessment Total Assessment is a certain percentage of the fair market value that is determined by local assessors to be the total taxable value of land and additions on the property. | Land | Improvement |
|---|---|---|---|---|
| 2025 | $6,971 | $1,187,500 | $756,900 | $430,600 |
| 2024 | $6,570 | $1,046,100 | $655,300 | $390,800 |
| 2023 | $5,933 | $857,400 | $522,400 | $335,000 |
| 2022 | $6,335 | $787,000 | $522,800 | $264,200 |
| 2021 | $5,731 | $674,200 | $447,500 | $226,700 |
| 2020 | $5,443 | $633,600 | $406,900 | $226,700 |
| 2019 | $5,381 | $628,600 | $406,900 | $221,700 |
| 2018 | $5,262 | $611,900 | $406,900 | $205,000 |
| 2017 | $5,167 | $605,700 | $406,900 | $198,800 |
| 2016 | $5,070 | $605,700 | $406,900 | $198,800 |
| 2015 | $4,961 | $605,700 | $406,900 | $198,800 |
| 2014 | $4,927 | $604,500 | $406,900 | $197,600 |
Source: Public Records
Map
Nearby Homes
- 179 Waterside Dr
- 33 Highcrest Rd
- 181 Waterside Dr
- 44 Highcrest Rd
- 40 Highcrest Rd
- 50 Highcrest Rd
- 33 Seascape Ln
- 41 Seascape Ln
- 36 Highcrest Rd
- 27 Seascape Ln
- 185 Waterside Dr
- 176 Waterside Dr
- 32 Highcrest Rd
- 169 Waterside Dr
- 180 Waterside Dr
- 28 Highcrest Rd
- 168 Waterside Dr
- 23 Seascape Ln
- 121 Waterside Dr
- 125 Waterside Dr