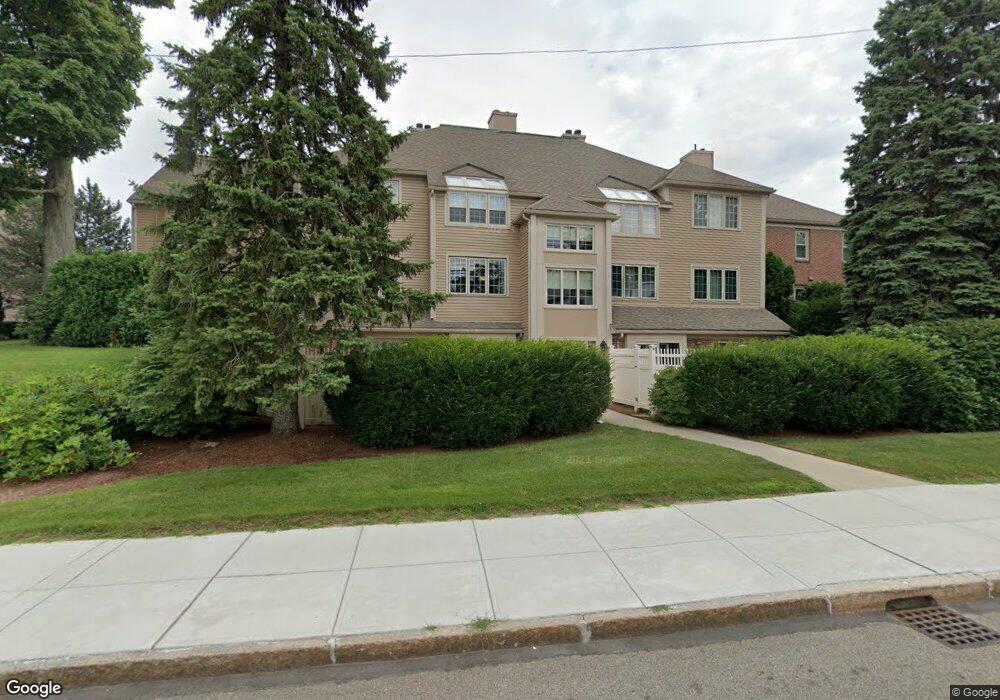
41 Highland Ct Needham, MA 02492
Estimated Value: $743,000 - $867,000
2
Beds
4
Baths
1,255
Sq Ft
$656/Sq Ft
Est. Value
About This Home
This home is located at 41 Highland Ct, Needham, MA 02492 and is currently estimated at $823,504, approximately $656 per square foot. 41 Highland Ct is a home located in Norfolk County with nearby schools including High Rock Middle School, Sunita L. Williams Elementary School, and Pollard Middle School.
Ownership History
Date
Name
Owned For
Owner Type
Purchase Details
Closed on
Jan 5, 2026
Sold by
Demaio Patrick J and Demaio Laura S
Bought by
Demaio Ft and Demaio
Current Estimated Value
Purchase Details
Closed on
Mar 3, 2017
Sold by
Shannon Int and Shannon S
Bought by
Demaio Patrick J and Demaio Laura S
Home Financials for this Owner
Home Financials are based on the most recent Mortgage that was taken out on this home.
Original Mortgage
$300,000
Interest Rate
4.09%
Mortgage Type
New Conventional
Purchase Details
Closed on
Jun 15, 2007
Sold by
Coughlan Evelyn H
Bought by
Shannon Int and Shannon S
Create a Home Valuation Report for This Property
The Home Valuation Report is an in-depth analysis detailing your home's value as well as a comparison with similar homes in the area
Home Values in the Area
Average Home Value in this Area
Purchase History
| Date | Buyer | Sale Price | Title Company |
|---|---|---|---|
| Demaio Ft | -- | -- | |
| Demaio Patrick J | $565,000 | -- | |
| Shannon Int | $556,000 | -- |
Source: Public Records
Mortgage History
| Date | Status | Borrower | Loan Amount |
|---|---|---|---|
| Previous Owner | Demaio Patrick J | $300,000 |
Source: Public Records
Tax History
| Year | Tax Paid | Tax Assessment Tax Assessment Total Assessment is a certain percentage of the fair market value that is determined by local assessors to be the total taxable value of land and additions on the property. | Land | Improvement |
|---|---|---|---|---|
| 2025 | $6,954 | $656,000 | $0 | $656,000 |
| 2024 | $7,894 | $630,500 | $0 | $630,500 |
| 2023 | $8,222 | $630,500 | $0 | $630,500 |
| 2022 | $8,184 | $612,100 | $0 | $612,100 |
| 2021 | $7,669 | $588,600 | $0 | $588,600 |
| 2020 | $6,741 | $539,700 | $0 | $539,700 |
| 2019 | $6,687 | $539,700 | $0 | $539,700 |
| 2018 | $6,053 | $509,500 | $0 | $509,500 |
| 2017 | $5,775 | $485,700 | $0 | $485,700 |
| 2016 | $5,605 | $485,700 | $0 | $485,700 |
| 2015 | $5,030 | $445,500 | $0 | $445,500 |
| 2014 | $5,346 | $459,300 | $0 | $459,300 |
Source: Public Records
Map
Nearby Homes
- 19 Highland Ct Unit 19
- 19 Oakland Ave Unit 19
- 193 Garden St
- 638 Webster St
- 638 Webster St Unit 638
- 58 Morton St
- 36 Otis St Unit 36
- 100 Rosemary Way Unit 129
- 510 Webster St
- 447 Hillside Ave
- 73 Maple St Unit 1
- 24 Mellen St
- 233 Warren St
- 385 Hillside Ave
- 385 Hillside Ave Unit 385
- 100 Bradford St
- 7 West St
- 3 Crescent Rd
- 68 Pleasant St Unit 68
- 34 Pershing Rd
- 45 Highland Ct Unit 1
- 5 Highland Ct
- 1 Highland Ct
- 23 Highland Ct
- 21 Highland Ct
- 45 Highland Ct
- 21 Highland Ct Unit 21
- 9 Highland Ct
- 9 Highland Ct Unit 9
- 1 Highland Ct Unit 1
- 29 Oakland Ave
- 19 Highland Ct Unit 24
- 27 Highland Ct
- 25 Highland Ct
- 19 Highland Ct
- 15 Highland Ct
- 17 Highland Ct
- 31 Highland Ct
- 17 Highland Ct Unit 17
- 17 Highland Ct Unit 4
Your Personal Tour Guide
Ask me questions while you tour the home.