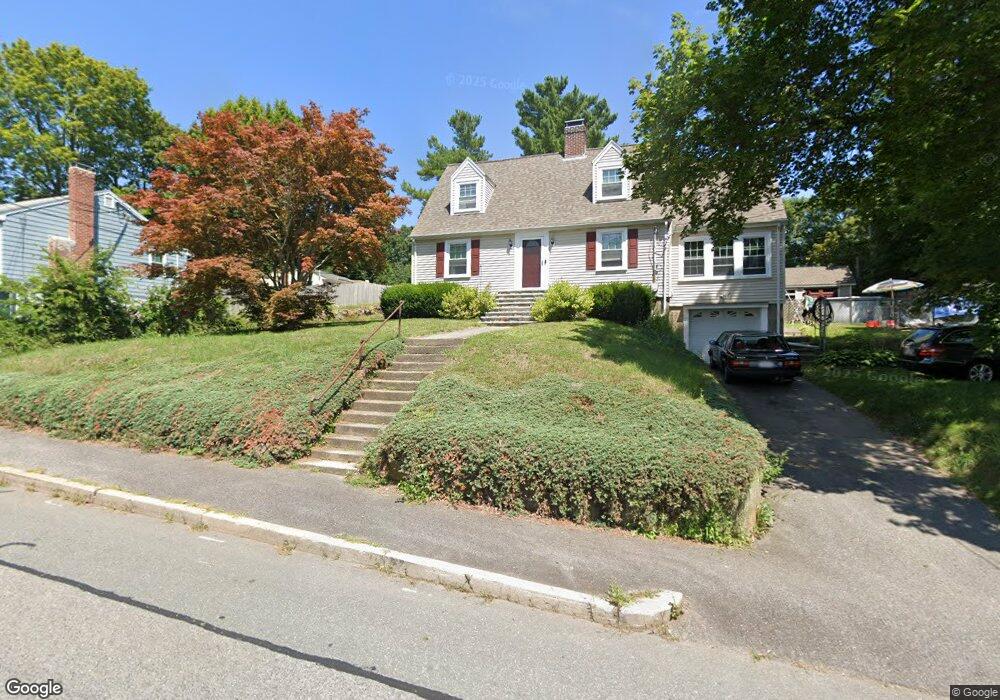
41 Hobart St Braintree, MA 02184
East Braintree NeighborhoodEstimated Value: $659,000 - $688,000
3
Beds
2
Baths
1,560
Sq Ft
$433/Sq Ft
Est. Value
About This Home
This home is located at 41 Hobart St, Braintree, MA 02184 and is currently estimated at $675,099, approximately $432 per square foot. 41 Hobart St is a home located in Norfolk County with nearby schools including Braintree High School, Sacred Heart Elementary School, and South Shore Christian Academy.
Ownership History
Date
Name
Owned For
Owner Type
Purchase Details
Closed on
Oct 30, 1997
Sold by
Amundsen David A
Bought by
Ballem Joseph A and Ballem Toni M
Current Estimated Value
Home Financials for this Owner
Home Financials are based on the most recent Mortgage that was taken out on this home.
Original Mortgage
$133,500
Outstanding Balance
$21,968
Interest Rate
7.31%
Mortgage Type
Purchase Money Mortgage
Estimated Equity
$653,131
Create a Home Valuation Report for This Property
The Home Valuation Report is an in-depth analysis detailing your home's value as well as a comparison with similar homes in the area
Home Values in the Area
Average Home Value in this Area
Purchase History
| Date | Buyer | Sale Price | Title Company |
|---|---|---|---|
| Ballem Joseph A | $141,000 | -- |
Source: Public Records
Mortgage History
| Date | Status | Borrower | Loan Amount |
|---|---|---|---|
| Open | Ballem Joseph A | $40,000 | |
| Open | Ballem Joseph A | $133,500 | |
| Previous Owner | Ballem Joseph A | $17,900 |
Source: Public Records
Tax History Compared to Growth
Tax History
| Year | Tax Paid | Tax Assessment Tax Assessment Total Assessment is a certain percentage of the fair market value that is determined by local assessors to be the total taxable value of land and additions on the property. | Land | Improvement |
|---|---|---|---|---|
| 2025 | $5,992 | $600,400 | $359,400 | $241,000 |
| 2024 | $5,432 | $573,000 | $335,100 | $237,900 |
| 2023 | $5,138 | $526,400 | $301,100 | $225,300 |
| 2022 | $4,948 | $497,300 | $272,000 | $225,300 |
| 2021 | $4,488 | $451,100 | $245,700 | $205,400 |
| 2020 | $4,228 | $428,800 | $223,400 | $205,400 |
| 2019 | $4,071 | $403,500 | $213,700 | $189,800 |
| 2018 | $3,968 | $376,500 | $194,300 | $182,200 |
| 2017 | $3,857 | $359,100 | $184,500 | $174,600 |
| 2016 | $3,570 | $325,100 | $155,400 | $169,700 |
| 2015 | $3,508 | $316,900 | $153,500 | $163,400 |
| 2014 | $3,320 | $290,700 | $139,900 | $150,800 |
Source: Public Records
Map
Nearby Homes
- 141 Hobart St
- 31 Tingley Rd
- 83 Edgemont Rd
- 312 Shaw St
- 21 Faxon St
- 145 Commercial St Unit 3
- 67 Somerville Ave
- 685 Union St
- 141 Commercial St Unit 9
- 69 Dobson Rd
- 51 Faxon St
- 9 Hillside Ave
- 14 Howard Ct
- 36 Brookside Rd
- 60 Edgehill Rd
- 1 Pantano St
- 64 Arborway Dr
- 37 Skyline Dr Unit 11
- 39 Morrison Rd
- 23 Bower Rd