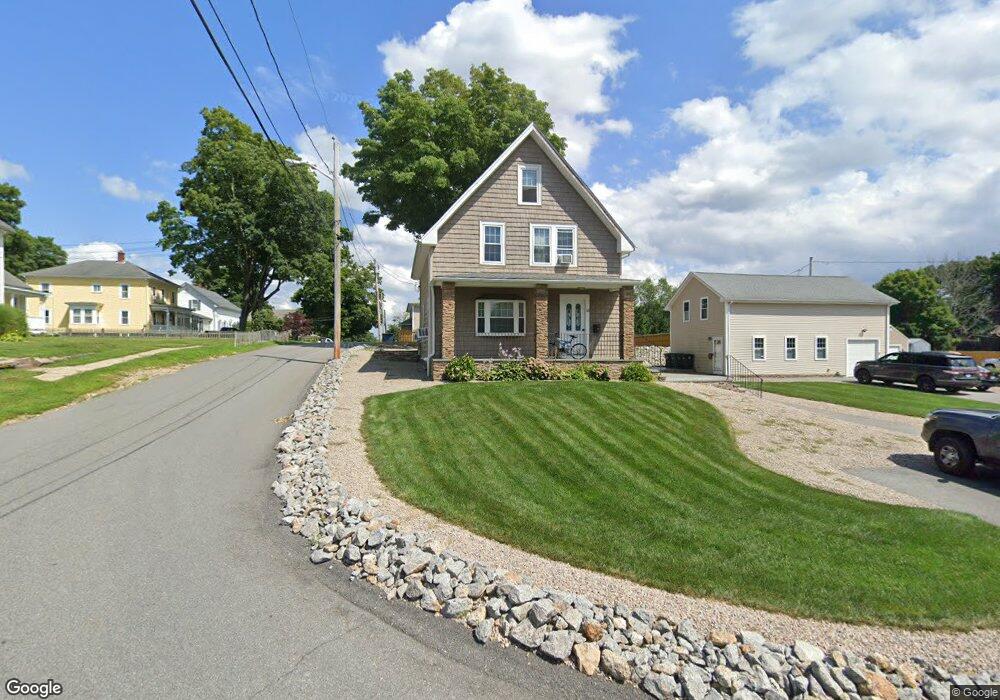
41 Holden St Coventry, RI 02816
Estimated Value: $425,856 - $515,000
3
Beds
2
Baths
2,028
Sq Ft
$233/Sq Ft
Est. Value
About This Home
This home is located at 41 Holden St, Coventry, RI 02816 and is currently estimated at $471,714, approximately $232 per square foot. 41 Holden St is a home located in Kent County with nearby schools including Alan Shawn Feinstein Ms Of Cov, Coventry High School, and Father John V. Doyle School.
Ownership History
Date
Name
Owned For
Owner Type
Purchase Details
Closed on
May 15, 2015
Sold by
Verrier Joseph R and Verrier Rose M
Bought by
Nolan Melissa A
Current Estimated Value
Home Financials for this Owner
Home Financials are based on the most recent Mortgage that was taken out on this home.
Original Mortgage
$148,000
Interest Rate
3.69%
Mortgage Type
New Conventional
Create a Home Valuation Report for This Property
The Home Valuation Report is an in-depth analysis detailing your home's value as well as a comparison with similar homes in the area
Purchase History
| Date | Buyer | Sale Price | Title Company |
|---|---|---|---|
| Nolan Melissa A | $168,000 | -- |
Source: Public Records
Mortgage History
| Date | Status | Borrower | Loan Amount |
|---|---|---|---|
| Open | Nolan Melissa A | $59,300 | |
| Open | Nolan Melissa A | $128,000 | |
| Closed | Nolan Melissa A | $148,000 |
Source: Public Records
Tax History
| Year | Tax Paid | Tax Assessment Tax Assessment Total Assessment is a certain percentage of the fair market value that is determined by local assessors to be the total taxable value of land and additions on the property. | Land | Improvement |
|---|---|---|---|---|
| 2025 | $5,072 | $315,200 | $111,300 | $203,900 |
| 2024 | $4,999 | $315,600 | $111,300 | $204,300 |
| 2023 | $4,838 | $315,600 | $111,300 | $204,300 |
| 2022 | $4,906 | $250,700 | $106,500 | $144,200 |
| 2021 | $4,864 | $250,700 | $106,500 | $144,200 |
| 2020 | $5,576 | $250,700 | $106,500 | $144,200 |
| 2019 | $4,455 | $200,300 | $87,700 | $112,600 |
| 2018 | $4,328 | $200,300 | $87,700 | $112,600 |
| 2017 | $4,202 | $200,300 | $87,700 | $112,600 |
| 2016 | $4,068 | $190,000 | $82,800 | $107,200 |
| 2015 | $3,958 | $190,000 | $82,800 | $107,200 |
| 2014 | $3,876 | $190,000 | $82,800 | $107,200 |
| 2013 | $4,077 | $218,500 | $100,000 | $118,500 |
Source: Public Records
Map
Nearby Homes
- 9 Francis St Unit 11
- 11 Francis St
- 10 Francis St
- 40 Holden St
- 40 Park St
- 29 Holden St Unit 31
- 40 Holden St Unit 203
- 40 Holden St Unit 103
- 40 Holden St Unit 101
- 40 Holden St Unit 102
- 40 Holden St Unit 104
- 40 Holden St Unit 201
- 40 Holden St Unit 202
- 40 Holden St Unit 204
- 40 Holden St Unit 1
- 40 Holden St
- 6 Francis St
- 30 Park St
- 15 Francis St
- 20 Park St
Your Personal Tour Guide
Ask me questions while you tour the home.