Estimated Value: $574,000 - $806,000
6
Beds
4
Baths
2,380
Sq Ft
$302/Sq Ft
Est. Value
About This Home
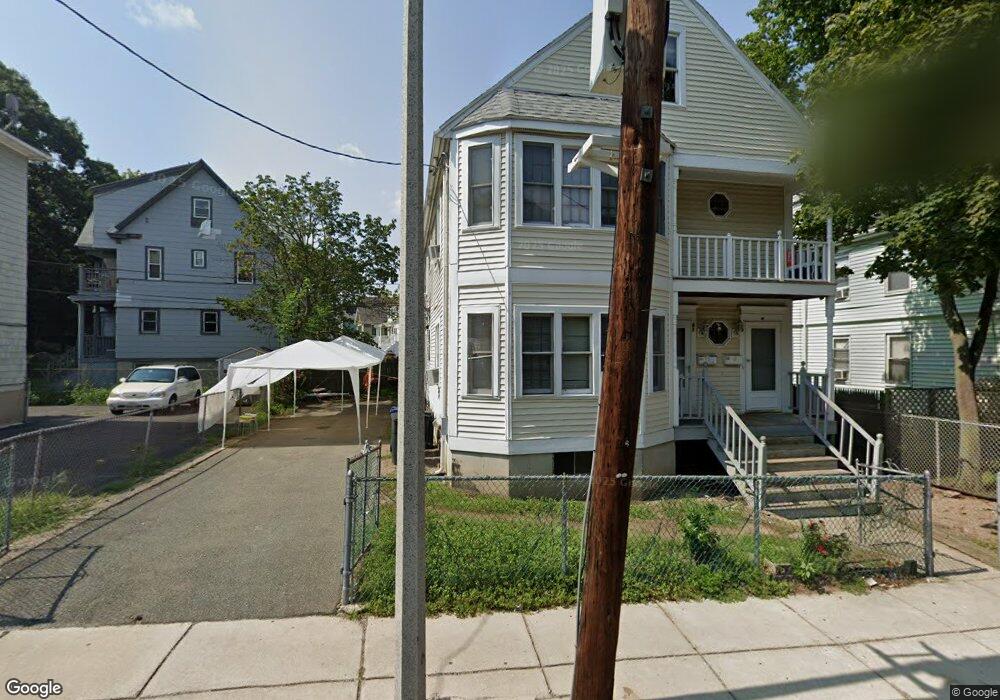
This home is located at 41 Howe St, Dorchester, MA 02125 and is currently estimated at $719,424, approximately $302 per square foot. 41 Howe St is a home located in Suffolk County with nearby schools including Pope John Paul II Catholic Academy Columbia Campus and Cristo Rey Boston High School.
Ownership History
Date
Name
Owned For
Owner Type
Purchase Details
Closed on
Feb 12, 2010
Sold by
Distressed Asset Acqu
Bought by
Lam Cindy
Current Estimated Value
Home Financials for this Owner
Home Financials are based on the most recent Mortgage that was taken out on this home.
Original Mortgage
$165,000
Interest Rate
4.95%
Mortgage Type
Purchase Money Mortgage
Purchase Details
Closed on
Jan 29, 2010
Sold by
Rue Denice D and Jp Morgan Chase Bk
Bought by
Pina Domingos G and Pina Cuong Vu
Home Financials for this Owner
Home Financials are based on the most recent Mortgage that was taken out on this home.
Original Mortgage
$165,000
Interest Rate
4.95%
Mortgage Type
Purchase Money Mortgage
Purchase Details
Closed on
Jun 1, 1998
Sold by
39-41 Howe St Rt and Bazile J Eddy
Bought by
Rue Deince D
Home Financials for this Owner
Home Financials are based on the most recent Mortgage that was taken out on this home.
Original Mortgage
$144,875
Interest Rate
7.12%
Mortgage Type
Purchase Money Mortgage
Create a Home Valuation Report for This Property
The Home Valuation Report is an in-depth analysis detailing your home's value as well as a comparison with similar homes in the area
Home Values in the Area
Average Home Value in this Area
Purchase History
| Date | Buyer | Sale Price | Title Company |
|---|---|---|---|
| Lam Cindy | $255,000 | -- | |
| Pina Domingos G | $165,000 | -- | |
| Distressed Asset Acq L | -- | -- | |
| Rue Deince D | $152,500 | -- |
Source: Public Records
Mortgage History
| Date | Status | Borrower | Loan Amount |
|---|---|---|---|
| Open | Rue Deince D | $180,000 | |
| Closed | Distressed Asset Acq L | $165,000 | |
| Previous Owner | Rue Deince D | $144,875 |
Source: Public Records
Tax History
| Year | Tax Paid | Tax Assessment Tax Assessment Total Assessment is a certain percentage of the fair market value that is determined by local assessors to be the total taxable value of land and additions on the property. | Land | Improvement |
|---|---|---|---|---|
| 2025 | $6,977 | $602,500 | $232,700 | $369,800 |
| 2024 | $6,103 | $559,900 | $204,900 | $355,000 |
| 2023 | $5,727 | $533,200 | $195,100 | $338,100 |
| 2022 | $5,324 | $489,300 | $179,000 | $310,300 |
| 2021 | $4,925 | $461,600 | $168,900 | $292,700 |
| 2020 | $4,061 | $384,600 | $168,100 | $216,500 |
| 2019 | $3,861 | $366,300 | $124,900 | $241,400 |
| 2018 | $3,429 | $327,200 | $124,900 | $202,300 |
| 2017 | $3,299 | $311,500 | $124,900 | $186,600 |
| 2016 | $3,144 | $285,800 | $124,900 | $160,900 |
| 2015 | $3,169 | $261,700 | $104,500 | $157,200 |
| 2014 | $3,075 | $244,400 | $104,500 | $139,900 |
Source: Public Records
Map
Nearby Homes
- 22 Ronan St
- 106 Sawyer Ave Unit 1
- 63 Downer Ave Unit 1
- 49 Hancock St
- 60 Stanley St Unit 303
- 60 Stanley St Unit 302
- 60 Stanley St Unit 101
- 60 Stanley St Unit 102
- 60 Stanley St Unit 203
- 60 Stanley St Unit 301
- 60 Stanley St Unit 202
- 22 High St Unit 202
- 22 High St Unit 203
- 22 High St Unit 201
- 22 High St Unit 103
- 22 High St Unit PH12
- 22 High St Unit PH13
- 22 High St Unit 101
- 22 High St Unit 104
- 22 High St Unit PH11
- 39 Howe St
- 37 Howe St
- 40 Rill St
- 45 Howe St
- 36 Rill St
- 42 Rill St
- 30 Howe St Unit 1
- 30 Howe St
- 30 Howe St Unit 32
- 30-32 Howe St
- 30-32 Howe St Unit 3
- 36 Howe St Unit C
- 36 Howe St Unit B
- 36 Howe St Unit A
- 34-36 Howe St Unit 3
- 34-36 Howe St Unit 2
- 34 Howe St Unit 36
- 34 Howe St Unit 3
- 34 Howe St Unit 2
- 34-36 Howe St Unit 1
Your Personal Tour Guide
Ask me questions while you tour the home.