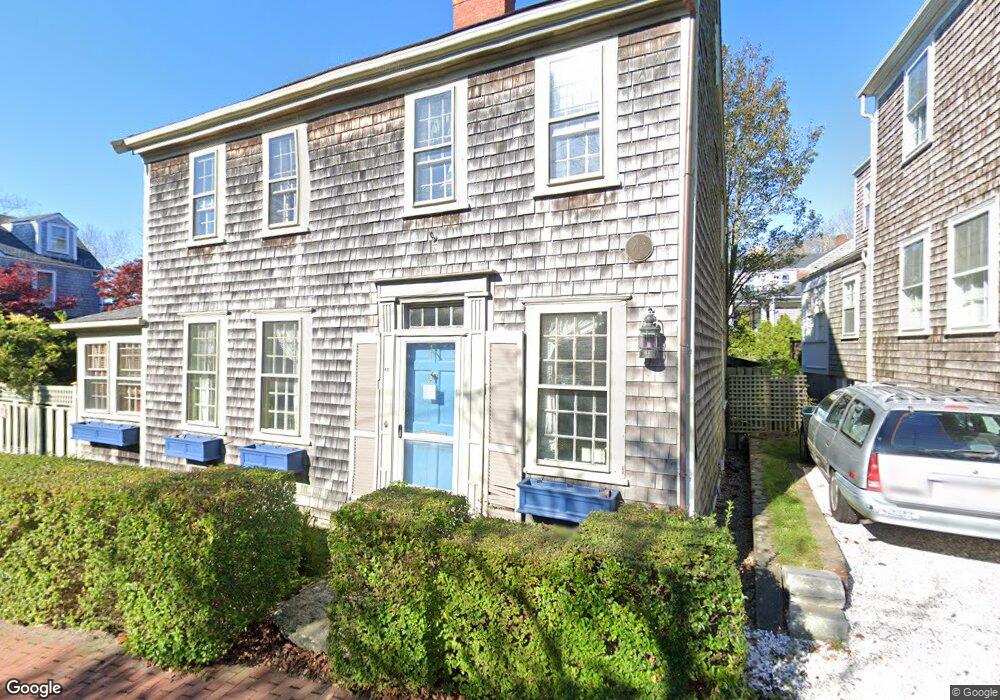
41 India St Nantucket, MA 02554
Estimated Value: $4,630,000 - $5,907,000
3
Beds
3
Baths
3,712
Sq Ft
$1,397/Sq Ft
Est. Value
About This Home
This home is located at 41 India St, Nantucket, MA 02554 and is currently estimated at $5,184,430, approximately $1,396 per square foot. 41 India St is a home located in Nantucket County with nearby schools including Nantucket Elementary School, Cyrus Peirce Middle School, and Nantucket High School.
Ownership History
Date
Name
Owned For
Owner Type
Purchase Details
Closed on
Mar 25, 2009
Sold by
Weller-Reade Eleanor and Constable-Weller Eleanor
Bought by
43 India Llc
Current Estimated Value
Purchase Details
Closed on
Dec 17, 1996
Sold by
Brent-Lucas Mary
Bought by
Constable-Weller E
Purchase Details
Closed on
Apr 30, 1990
Sold by
Chace Cornelia D
Bought by
Constable Eleanor
Create a Home Valuation Report for This Property
The Home Valuation Report is an in-depth analysis detailing your home's value as well as a comparison with similar homes in the area
Home Values in the Area
Average Home Value in this Area
Purchase History
| Date | Buyer | Sale Price | Title Company |
|---|---|---|---|
| 43 India Llc | $9,022 | -- | |
| 43 India Llc | $9,022 | -- | |
| 43 India Llc | $9,022 | -- | |
| Constable-Weller E | $146,667 | -- | |
| Constable-Weller E | $146,667 | -- | |
| Constable Eleanor | $410,000 | -- | |
| Constable Eleanor | $410,000 | -- |
Source: Public Records
Mortgage History
| Date | Status | Borrower | Loan Amount |
|---|---|---|---|
| Previous Owner | Constable Eleanor | $970,000 | |
| Previous Owner | Constable Eleanor | $100,000 |
Source: Public Records
Tax History Compared to Growth
Tax History
| Year | Tax Paid | Tax Assessment Tax Assessment Total Assessment is a certain percentage of the fair market value that is determined by local assessors to be the total taxable value of land and additions on the property. | Land | Improvement |
|---|---|---|---|---|
| 2025 | $12,916 | $3,937,700 | $2,183,000 | $1,754,700 |
| 2024 | $12,305 | $3,931,300 | $2,223,400 | $1,707,900 |
| 2023 | $10,222 | $3,184,500 | $2,117,500 | $1,067,000 |
| 2022 | $10,539 | $2,818,000 | $1,926,000 | $892,000 |
| 2021 | $9,184 | $2,530,000 | $1,540,800 | $989,200 |
| 2020 | $9,708 | $2,814,000 | $1,669,200 | $1,144,800 |
| 2019 | $12,254 | $3,646,900 | $1,666,600 | $1,980,300 |
| 2018 | $10,238 | $2,900,400 | $1,602,500 | $1,297,900 |
| 2017 | $9,475 | $2,794,900 | $1,557,600 | $1,237,300 |
| 2016 | $7,727 | $2,299,600 | $1,089,700 | $1,209,900 |
| 2015 | $8,263 | $2,288,900 | $1,106,000 | $1,182,900 |
| 2014 | $8,107 | $2,156,200 | $973,300 | $1,182,900 |
Source: Public Records
Map
Nearby Homes